The SEO Debugging Workflow: A Production Engineering Framework for Diagnosing Ranking Drops in Under 48 Hours
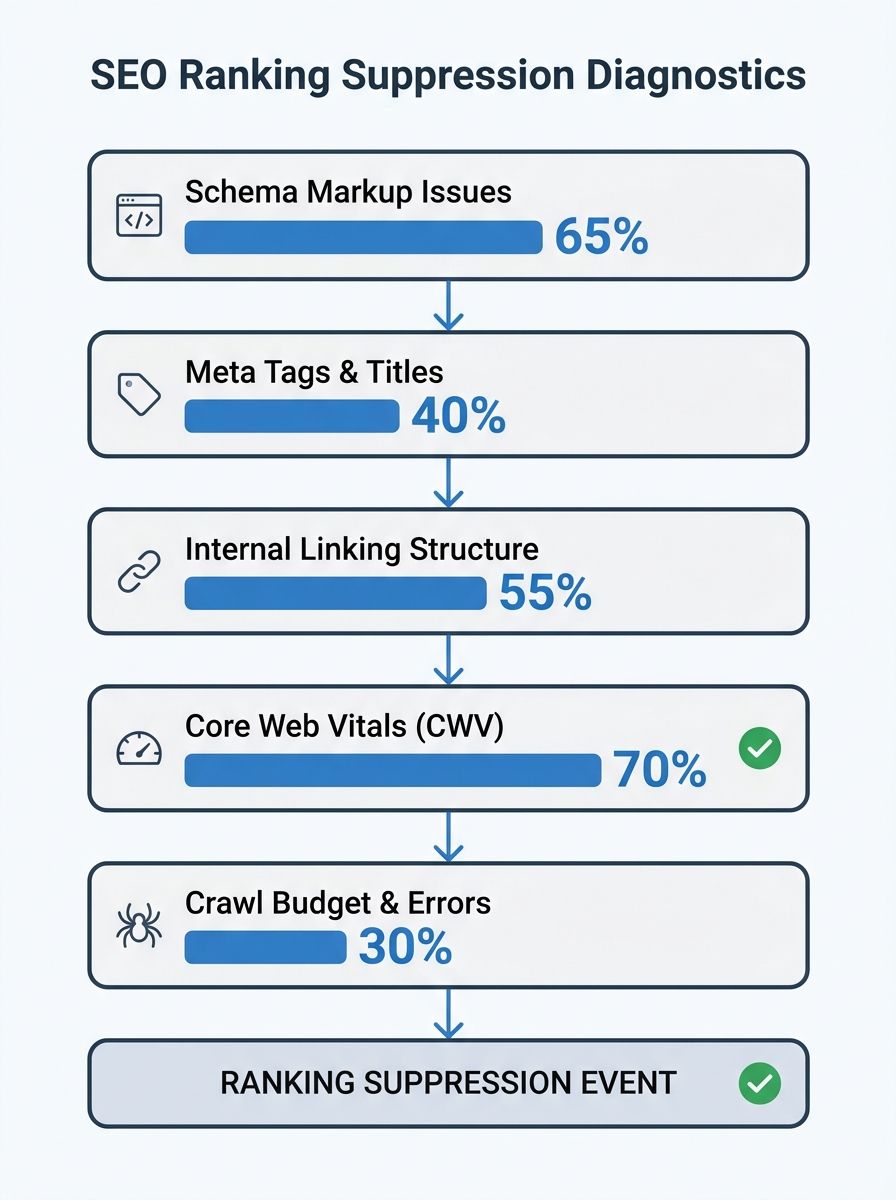
Five categories of technical error — missing schema markup, meta tag gaps, internal linking deficiencies, Core Web Vitals failures, and crawl budget waste — account for 82% of ranking suppression events across websites.
 Marcus Webb··8 min read
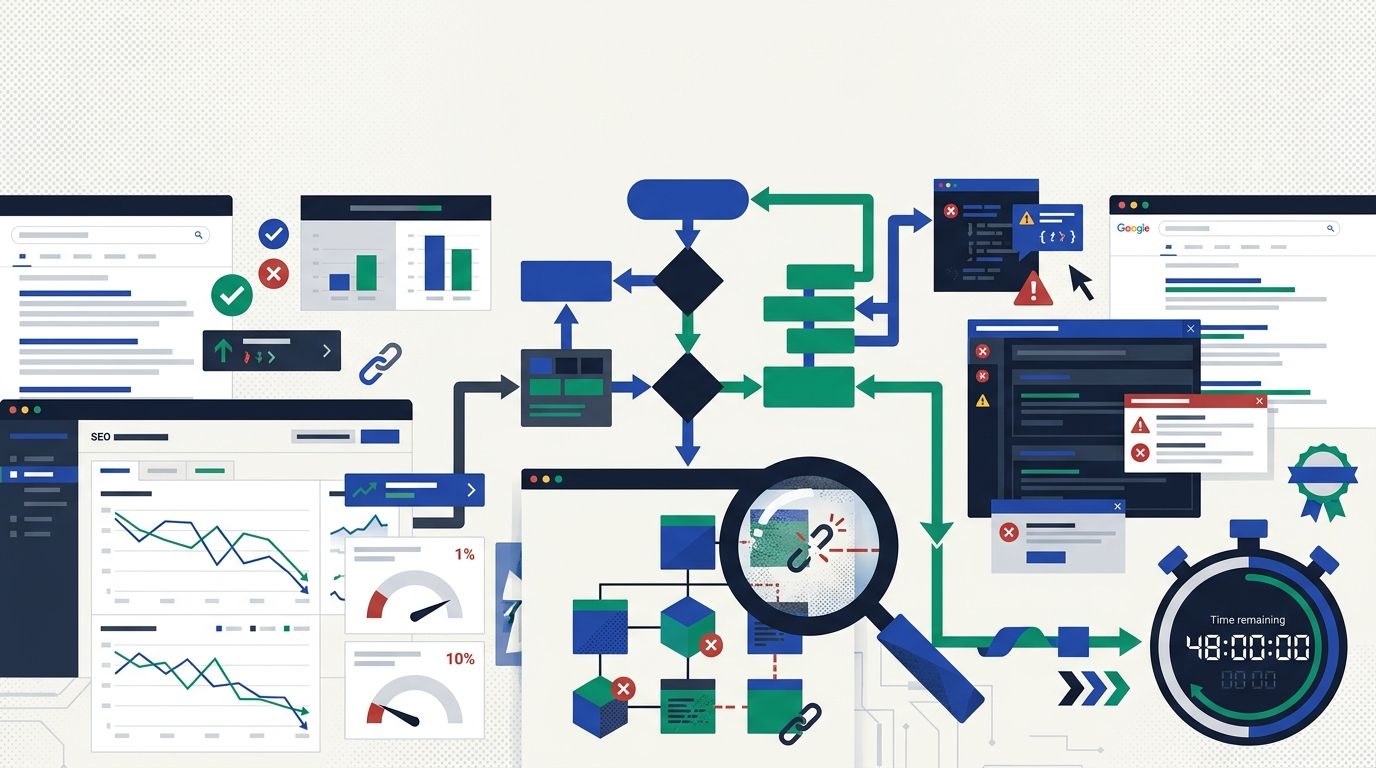
The SEO Debugging Workflow: A Production Engineering Framework for Diagnosing Ranking Drops in Under 48 Hours
Five categories of technical error — missing schema markup, meta tag gaps, internal linking deficiencies, Core Web Vitals failures, and crawl budget waste — account for 82% of ranking suppression events across websites. A production engineering approach to ranking drop diagnosis narrows the root cause within 48 hours, before compounding traffic loss turns a recoverable dip into a quarter-defining crisis.
Five Technical Failures Behind 82% of Ranking Drops
Schema markup is absent from 73% of sites experiencing ranking suppression. Meta tag gaps affect 61%. Internal linking deficiencies show up on 58%, Core Web Vitals failures on 44%, and crawl budget waste on 39%. These five categories overlap — a single site often has two or three of them active simultaneously — but they cover the territory that matters for technical SEO troubleshooting.
Why does this distribution matter for your debugging workflow? Because it gives you a decision tree instead of a scavenger hunt. Bart Magera's diagnostic framework argues that DIY diagnosis works for single-page or single-cause drops with obvious recent changes, but a sitewide drop sustained past 30 days demands a structured audit. The 82% concentration in five categories means your initial investigation has a defined search space.
I've reviewed agencies that spend two to three weeks chasing ranking drops because they start with the wrong category. They'll rebuild content when the actual problem is a canonical conflict. They'll disavow backlinks when the real issue is crawl budget getting eaten by faceted navigation URLs. The triage order matters as much as the analysis itself.
The 48-Hour Triage Protocol
Production engineering teams at software companies don't debug outages by randomly checking systems. They follow incident response protocols — structured sequences that move from broad confirmation to narrow isolation. The same discipline applies to visibility loss root cause analysis. An SEO debugging methodology modeled on production engineering combines monitoring dashboards, structured incident response, and periodic deep-dive reviews to cover the widest range of failure modes with the least wasted effort.
Here's the phased protocol I recommend to every agency I evaluate, broken into five time windows.
Hours 0-4: Confirm the Drop and Check Indexation
Before diagnosing anything, verify the drop is real and quantify its scope. Pull Google Search Console data segmented by query, page, device, and country. A 15% click decline that's isolated to mobile branded queries tells a different story than a 15% decline across all informational pages.
Check three things in this window: Is the affected URL still indexed? Is the canonical tag pointing to the intended version? Is anything in robots.txt or a noindex directive blocking access? Canonical conflicts are a primary driver of suppressed rankings because Google may select an unintended canonical version and suppress the page you're actually trying to rank.
This four-hour window should produce a one-page incident summary: affected URLs, affected queries, magnitude of decline, date of onset, and indexation status. If the page isn't indexed, you've already found your root cause.
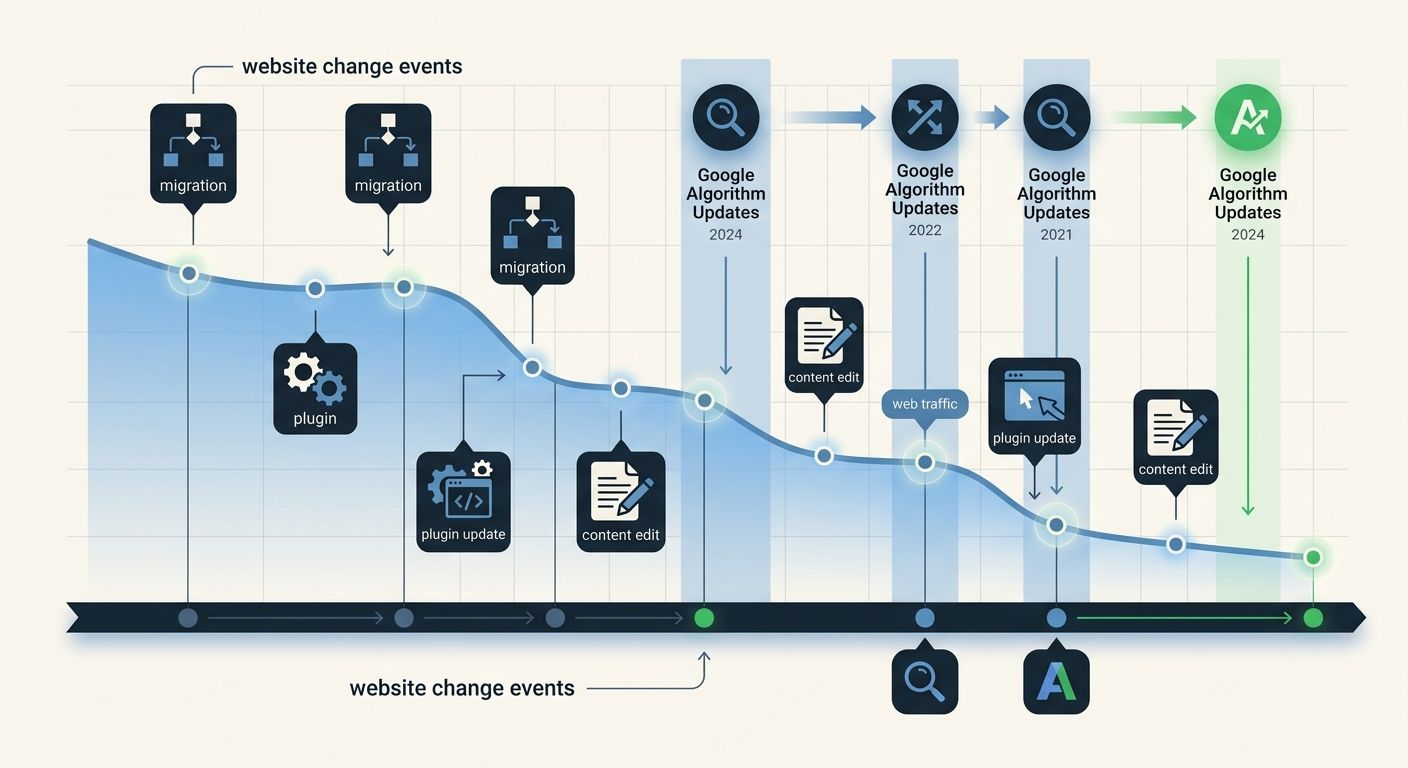
Hours 4-12: Change Event Mapping
Rank drops correlate to events. Your job in this phase is to build a timeline of every change that preceded the decline. Site migrations, HTTPS updates, redirect chains, CMS plugin updates, content edits, internal link removals, and template changes all qualify. Analysis shows that website migrations trigger 50% traffic drops that can persist up to 18 months when SEO teams miss the launch window, so even changes that seem minor deserve scrutiny.
Cross-reference your change log against Google's update history. Google confirmed its May 2026 core update completed after a 12-day rollout marked by multi-phase volatility — if your drop falls inside that window, the algorithm is a likely contributor. Separating algorithm-driven drops from self-inflicted technical damage is the single most important distinction in this phase.
Hours 12-24: Intent Classification
Here's the gap that catches technically clean sites. You can pass every technical SEO audit — valid schema, fast load times, proper canonicals — and still lose rankings if the search intent for your target queries has shifted. Siteoscope's diagnostic framework puts this bluntly: if the dominant intent for a query no longer matches your page, no amount of technical optimization will recover the position.
The process: pull the top 10 results for every keyword that dropped. Classify each result's intent type — informational, transactional, navigational, or commercial investigation. If Google has shifted the SERP from product pages to comparison guides for your target term, your product page will fall regardless of its technical health.
This phase often reveals that keyword intent mismatches are driving the loss, and the fix is content-level rather than technical. I've seen agencies waste entire retainer months optimizing page speed on a page that needs to be rewritten as a buyer's guide.
Hours 24-36: Crawl Efficiency and Performance Audit
Crawl budget waste affects 39% of sites with suppressed rankings. Large product catalogs generate filter URLs that dilute crawl budget. Uncompressed images slow rendering. Product specifications locked inside PDF catalogs can't be indexed by search engines at all.
In this phase, run a full crawl and compare it against server log data from the last 14 days. Server logs catch issues that synthetic crawlers miss — unexpected redirect chains, intermittent 5xx errors on specific templates, and staging environment controls leaking into production.
Check Core Web Vitals performance at the URL level, not the domain level. A domain-wide CWV pass can mask individual template failures. If your blog template scores well but your product template fails Largest Contentful Paint, you'll see ranking drops concentrated on product pages while blog content holds steady.
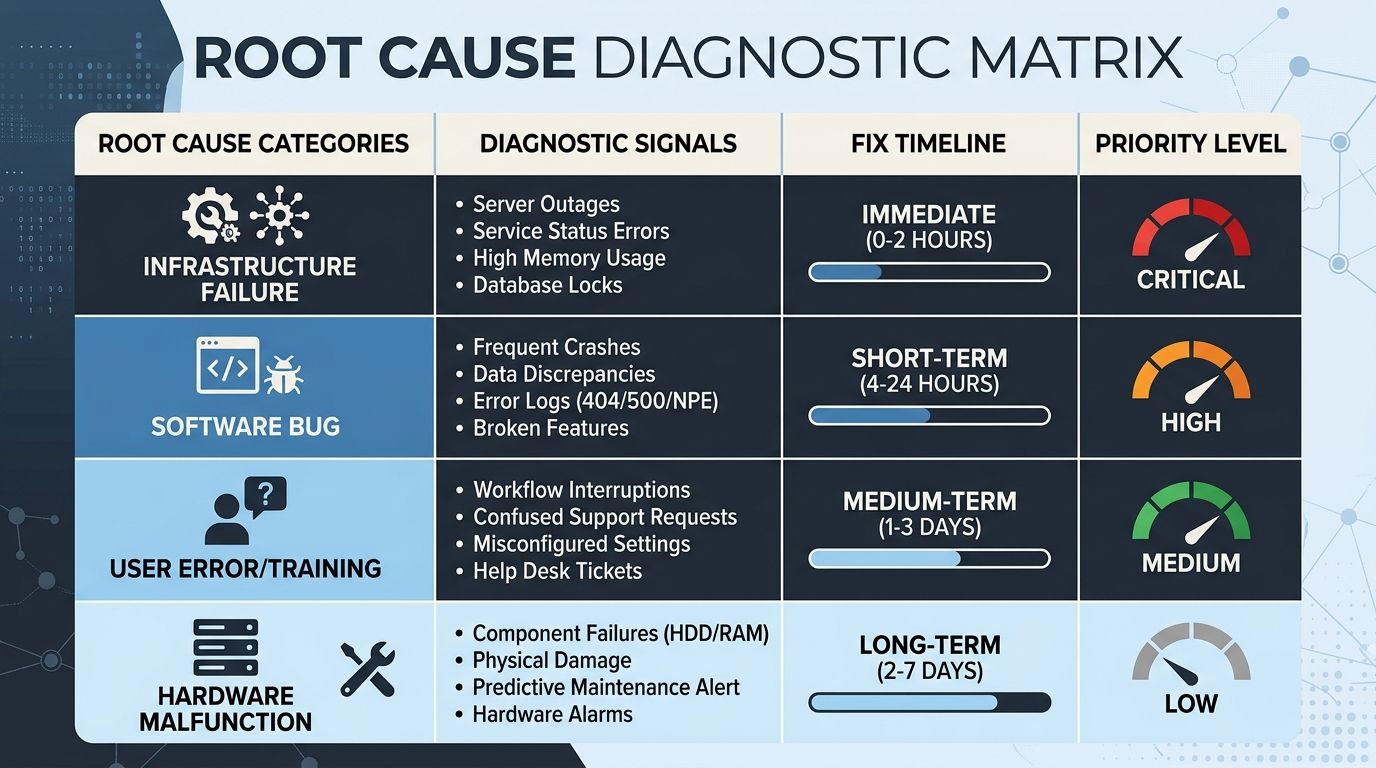
Hours 36-48: Root Cause Lock and Remediation Plan
By hour 36, you should have narrowed the cause to one of four buckets:
Root Cause Category | Diagnostic Signal | Typical Fix Timeline |
|---|---|---|
Indexation/canonical conflict | URL not indexed or wrong canonical selected | 3-7 days after fix deployed |
Self-inflicted technical change | Drop correlates to a specific site change | 7-14 days for re-crawl and recovery |
Algorithm update | Drop timing matches update rollout; no site changes | 14-30 days; may require content-level changes |
Intent shift | SERP composition changed; technical signals are clean | 30-60 days for content revision and re-ranking |
This table drives your remediation plan. An indexation fix is deployable immediately. An intent shift requires content strategy work that extends well beyond the 48-hour diagnostic window.
Building a Diagnostic-Ready SEO Monitoring Dashboard
An SEO monitoring dashboard built for ongoing tracking is different from one built for incident diagnosis. The Improvado analytics framework distinguishes three dashboard tiers: an SEO manager dashboard tracking 15 metrics with daily refresh, an analyst deep-dive dashboard with 50+ metrics and SQL access for custom queries, and an operational dashboard for real-time monitoring.
For ranking drop diagnosis, you need a hybrid. The operational dashboard catches the drop. The analyst dashboard provides the diagnostic depth. If you're building a transparent reporting dashboard for clients, add a diagnostic layer that surfaces anomaly alerts when any tracked URL drops more than 5 positions within a 7-day window.
The minimum diagnostic dashboard needs five data streams: Google Search Console impressions and clicks by query, crawl stats from your crawl tool, Core Web Vitals by template type, indexation coverage by section, and a change log with timestamps. Most BI tools — Looker Studio, Tableau, Power BI — support scheduled email delivery, so you can automate daily anomaly alerts without manual monitoring.
If your current tool stack doesn't support this level of granularity, that's a structural problem worth addressing before your next ranking drop forces you into ad hoc diagnosis.
Safe Automation Tiers for Ranking Drop Diagnosis
Production-grade SEO debugging increasingly involves automated detection and remediation. But automation introduces its own risks. Here's how to classify which fixes are safe to automate and which require human judgment:
Safe for full automation: JSON-LD schema generation, canonical tag correction, meta title and description optimization for character-length violations, robots meta directives for thin or duplicate content. These are rule-based fixes with predictable outcomes and low risk of unintended consequences.
Require strategist review: Contextual internal link insertion, heading hierarchy restructuring, hreflang implementation. These involve content decisions where automation can introduce errors that are harder to detect than the original problem.
Require human decision-making: Content consolidation (merge vs. redirect vs. delete), site architecture changes, and URL migration planning. Automating these is the fastest way to turn a ranking drop into a ranking collapse. SEO Sherpa's recovery framework emphasizes that technical audits are often the first step in diagnosing ranking drops, but the remediation decisions that follow demand human expertise.
Current data shows 89% of teams using AI-driven SEO agents have adopted observability platforms to trace automated decisions, though only 52% implement proper evaluation frameworks. That 37-percentage-point gap between adoption and evaluation is where automated SEO debugging goes wrong.
Recovery Timelines the Data Supports
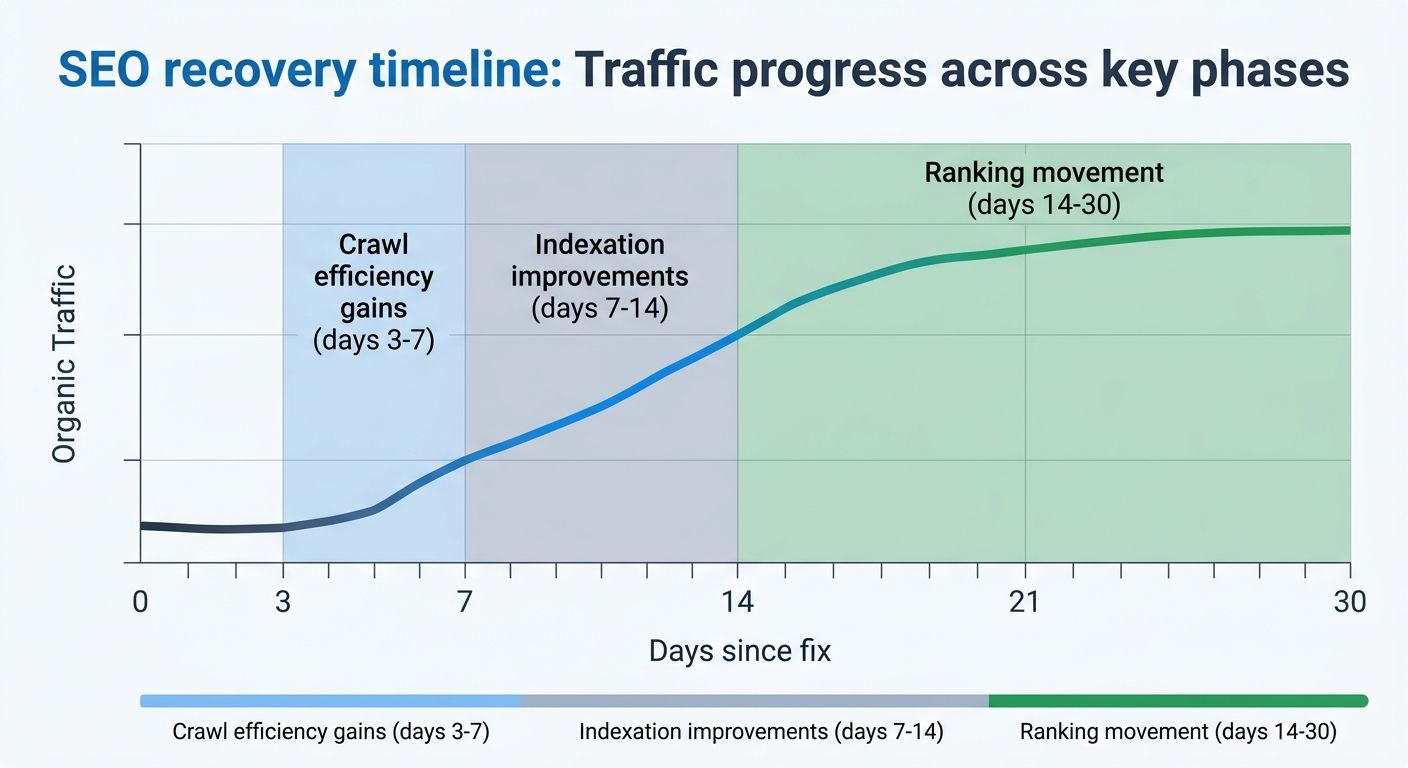
Once you've identified and fixed the root cause, recovery follows a predictable sequence. Sites implementing corrections observe improvements in three phases: crawl efficiency gains appear in days 3 through 7 as search engines discover cleaner architecture, indexation improvements follow in days 7 through 14 for previously orphaned or poorly structured pages, and measurable ranking movement shows up in days 14 through 30 — particularly for keywords where the site was already in positions 11 through 30.
One documented recovery case showed organic traffic exceeding previous levels by 21% within three months after correcting performance issues, rebuilding page content, and restoring local keyword structure. The key qualifier: the site aligned more closely with Google's content quality standards after the fix than it had before the drop. The recovery wasn't a return to baseline — it was an improvement because the diagnostic process exposed pre-existing weaknesses.
Visibility recovery holds longer when domain-wide quality stays consistent. The ongoing maintenance pattern that sustains recovery involves continued page quality improvement, toxic link removal, internal link support for key pages, and fresh content — tracked together as visibility signals, not just individual rank positions.
What The Data Doesn't Tell Us
The 82% concentration figure is useful for narrowing your search, but it carries a survivorship bias: it measures the failures that get diagnosed. The remaining 18% includes edge cases — algorithmic penalties, competitive displacement, SERP feature changes, and AI Overview expansion displacing traditional results — that are harder to categorize and harder to fix.
The 48-hour triage protocol also assumes you have the right tooling in place before the drop happens. Google Search Console data has a 48-to-72-hour reporting lag. If your crawl tool runs weekly instead of daily, you're already behind. And if your team doesn't maintain a change log, the event mapping phase in hours 4 through 12 becomes reconstruction from memory — unreliable at best.
Recovery timelines are averages drawn from documented cases, and your mileage will vary based on domain authority, competitive density, and the specific nature of the fix. A canonical tag correction on a high-authority domain recovers faster than an intent-shift content rewrite on a newer site. The framework gives you structure and speed. The judgment calls within each phase still require someone who understands both the data and the business context behind the pages that dropped.
Marcus Webb
Digital marketing consultant and agency review specialist. With 12 years in the SEO industry, Marcus has worked with agencies of all sizes and brings an insider perspective to agency evaluations and selection strategies.
Explore more topics