The SEO Debugging Pyramid: A Structured Framework for Diagnosing Traffic Drops Before They Become Crises
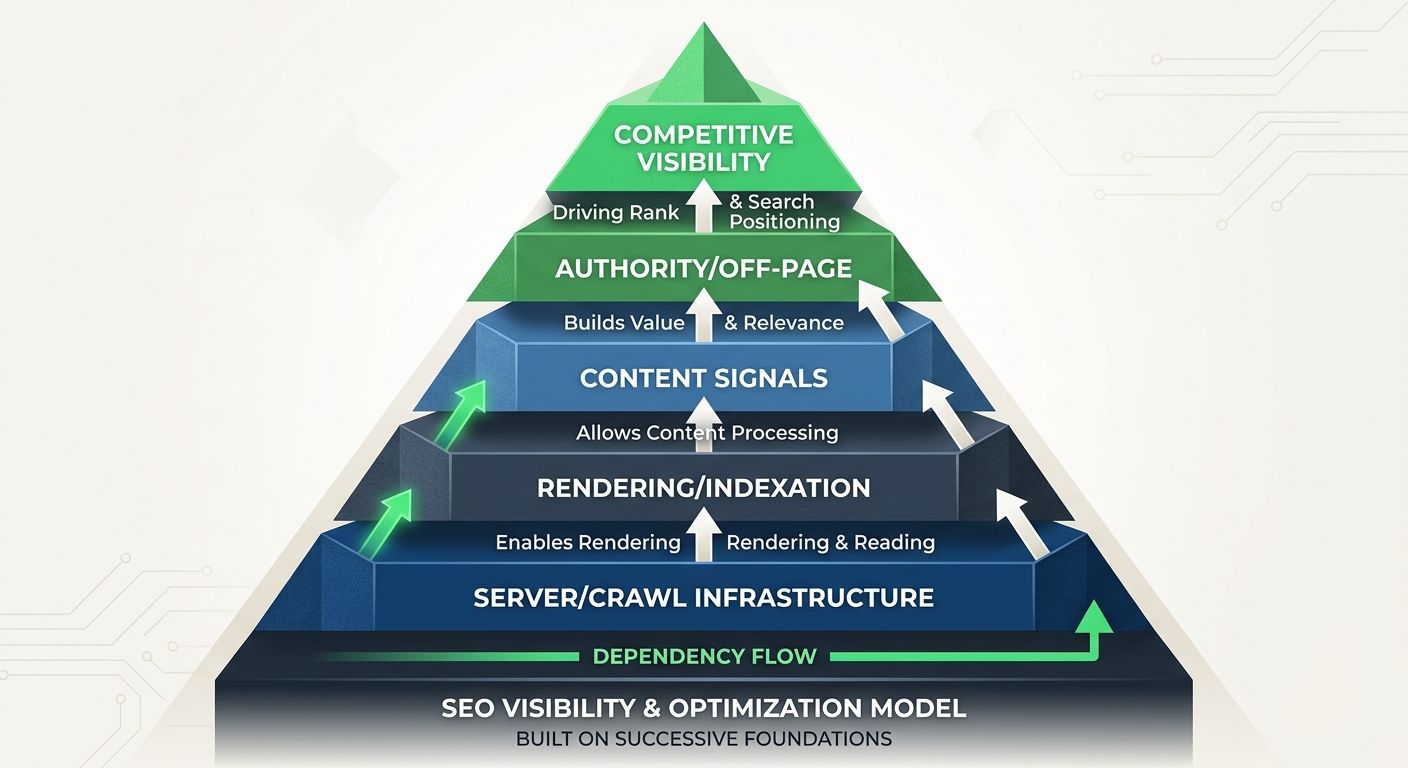
The SEO Debugging Pyramid is a five-layer diagnostic hierarchy (server infrastructure, crawl access, rendering and indexation, content signals, and authority/competitive visibility) that forces teams to troubleshoot organic traffic drops from the bottom up, preventing wasted effort on content rewrit
 Marcus Webb··9 min read
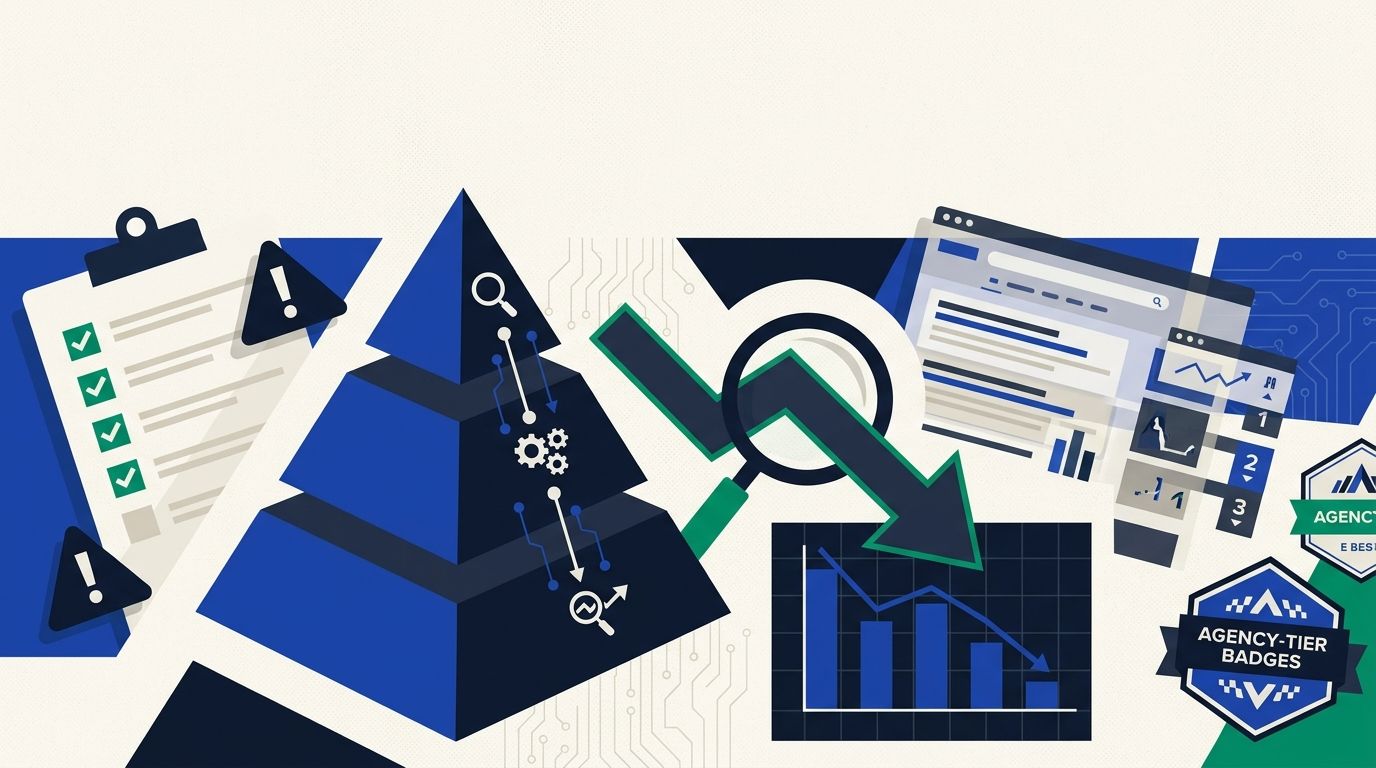
The SEO Debugging Pyramid: A Structured Framework for Diagnosing Traffic Drops Before They Become Crises
The SEO Debugging Pyramid is a five-layer diagnostic hierarchy (server infrastructure, crawl access, rendering and indexation, content signals, and authority/competitive visibility) that forces teams to troubleshoot organic traffic drops from the bottom up, preventing wasted effort on content rewrites when the actual failure sits in a server log nobody checked.
Layer Zero: Validate the Data Before You Diagnose
Before touching a single layer of the pyramid, you need to confirm the drop is real. Google's September 2025 Search Console reporting changes created widespread confusion when the removal of the &num=100 parameter altered how rank-tracking tools reported positions, making some traffic losses look worse than they actually were. Around 60% of Google searches in 2025 ended without a click, according to Digital Bloom's Organic Traffic Crisis report, which means impression data and click data tell different stories depending on your query mix.
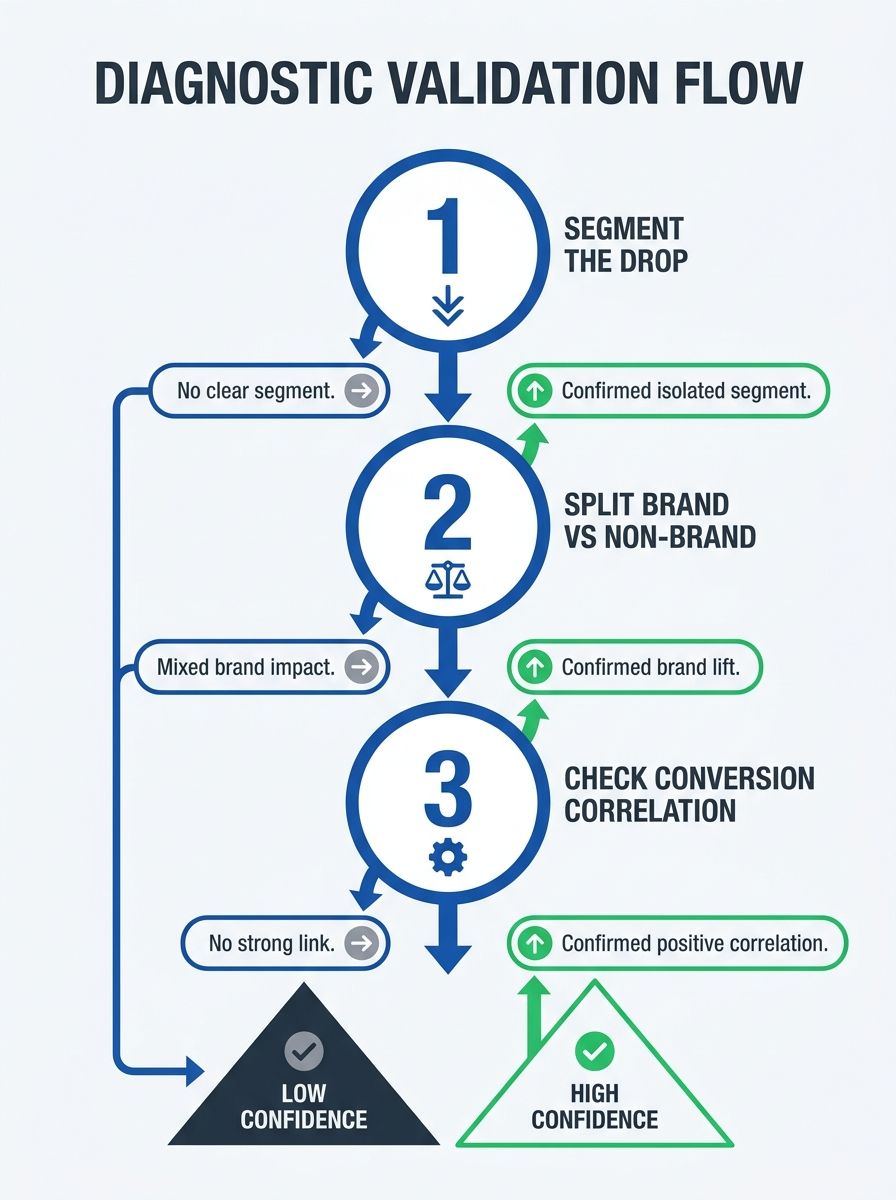
I've evaluated over 200 agencies in my career, and the single most common mistake I see in technical SEO troubleshooting is teams skipping data validation entirely. They see a graph going down and immediately start rewriting title tags or disavowing backlinks. The three-part validation check I recommend before any pyramid diagnosis:
Segment the drop. Is it isolated to a single country, device type, or subdirectory? A mobile-only decline on /blog/ pages points to a completely different root cause than a sitewide 30% drop across all devices.
Split brand versus non-brand traffic. Stable branded search volume with collapsing non-brand queries suggests ranking or competitive problems at layers 3 through 5. A decline in branded traffic, as SEOClarity's traffic loss analysis framework notes, points toward reduced brand awareness, reputation shifts, or deep technical problems at layers 1 and 2.
Check conversion correlation. If sessions dropped 25% but leads stayed flat or rose, you likely lost low-intent traffic. The business impact is minimal, and panic-driven SEO changes could make things worse.
This validation step prevents what I call "diagnosis theater," where an agency spends 40 hours auditing content quality when the real culprit is a Search Console reporting artifact or a Google Business Profile reclassification that moved organic-attributed traffic into a different channel bucket. If your team has been benchmarking performance metrics without validating the underlying data, every conclusion built on those numbers is suspect.
How Crawl Failures Cascade Upward
Layer 1 of the pyramid is server and crawl infrastructure. It sits at the base because every layer above depends on it completely. Search Engine Land's SEO debugging guide puts it plainly: "You can't achieve great rankings without good indexation. Your pages won't be indexed without proper rendering. And you can't render what Google can't crawl."
The specific failure signals at this layer include 5xx server errors during Googlebot's peak crawl windows (typically 2:00 AM to 6:00 AM in your server's timezone), response times exceeding 500 milliseconds during crawl sessions, and robots.txt rules that accidentally block critical page groups. Approximately 10% of websites experience regular server errors that block proper crawling, making this the layer where most undetected organic traffic diagnostics failures originate.
Server log analysis is the primary tool here, and it surfaces problems days before Search Console reports them. Google Search Console's coverage report updates on a 3-to-7-day delay for most sites. If Googlebot hit a 503 error on 4,000 product pages last Tuesday, you won't see the indexation impact in GSC until the following week. By then, rankings have already started sliding.
Dynamic JavaScript content compounds the problem. JS-rendered pages consume more crawl budget than static HTML because Googlebot must make a second pass (the rendering wave) after the initial crawl. For sites with 50,000+ pages, this rendering overhead can mean that 15% to 30% of pages never get fully processed during a given crawl cycle, according to SEO practitioners cited in Moz's 8-point checklist for debugging strange technical SEO problems.
Rendering and Indexation Gaps That Hide in Plain Sight
The indexation ratio (indexed URLs divided by submitted URLs in your sitemap) is the single most diagnostic metric at layer 2. A site submitting 10,000 URLs via sitemap but showing only 6,000 indexed pages has a 40% gap that demands immediate investigation. That gap represents pages Google either can't render, chooses not to index, or has flagged as low-quality duplicates.
A single template change on a JavaScript-heavy site can silently affect thousands of pages if Googlebot fails to execute the updated scripts during rendering. This is why monitoring page changes alongside performance data matters so much. SEOClarity's monitoring research found that knowing what changed and when shortens diagnosis time dramatically, because you can correlate a specific deployment timestamp with the exact moment indexation metrics shifted.
Tools that catch these rendering failures include Screaming Frog's JavaScript rendering mode, Google's URL Inspection Tool (which shows you exactly what Googlebot sees versus what a browser sees), and real-time crawl monitors like ContentKing or SEO Radar. The URL Inspection Tool is free and often underused. It reveals the rendered HTML that Googlebot actually processed, which frequently differs from what your QA team sees in Chrome.
For agencies working through technical SEO workflow gaps before publishing, indexation monitoring should run as a post-deployment check on every release, not as a monthly audit item.
Content Signals and Authority Get Diagnosed First, But Break Last
Layers 3 and 4 of the pyramid cover content quality signals (keyword targeting, user intent alignment, internal linking structure, on-page optimization) and authority signals (backlink profile, brand mentions, E-E-A-T indicators). These are the layers where most SEO teams start their diagnosis, which is exactly backward.
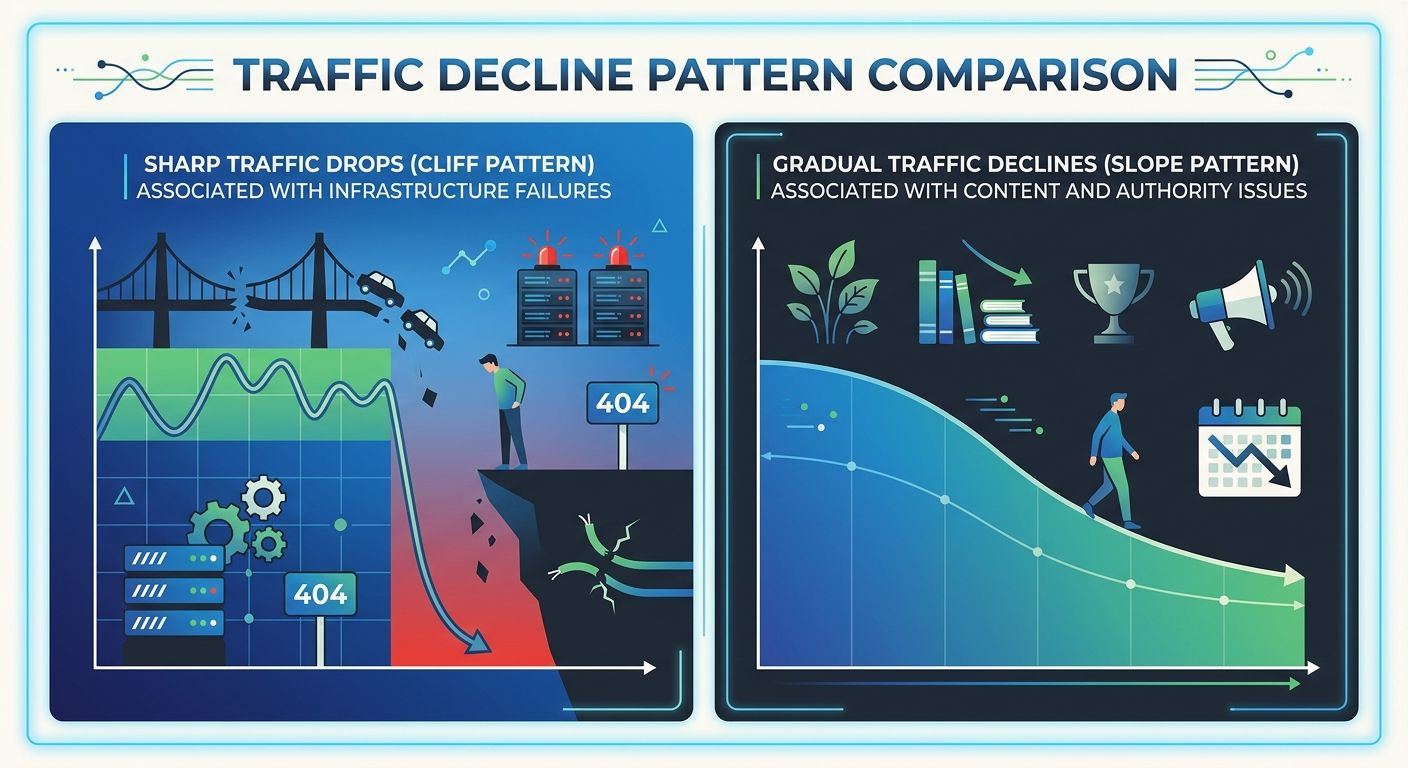
The reason is psychological: content and backlinks are the SEO activities most teams spend time on daily, so they're the first places people look when something goes wrong. But content-layer problems produce gradual ranking erosion over weeks or months, while crawl and indexation failures produce sharp drops within days. If your organic traffic graph shows a cliff (a 20% to 40% decline in under a week), the root cause is almost certainly at layers 1 or 2, not here.
When the drop genuinely lives at layer 3, the most common culprit is intent mismatch following a core algorithm update. Google's March 2026 core update, which disrupted enterprise SEO playbooks significantly, reshuffled 79.5% of top-3 positions according to SE Ranking's volatility index. Cedarwood Digital's analysis confirms this pattern: "If the user intent changes, and your website is not providing users with the information they are looking for, you'll probably lose rankings so that Google can provide users with the most helpful and relevant content."
At the authority layer, keyword cannibalization deserves special attention. A content strategy audit from Promotika noted that keyword cannibalization is one of the most common internal issues that agencies surface alongside competitor positioning gaps and coverage holes. If 3 pages on your site target the same keyword cluster and none of them rank in the top 10, consolidation into a single authoritative page typically recovers lost positions within 4 to 8 weeks.
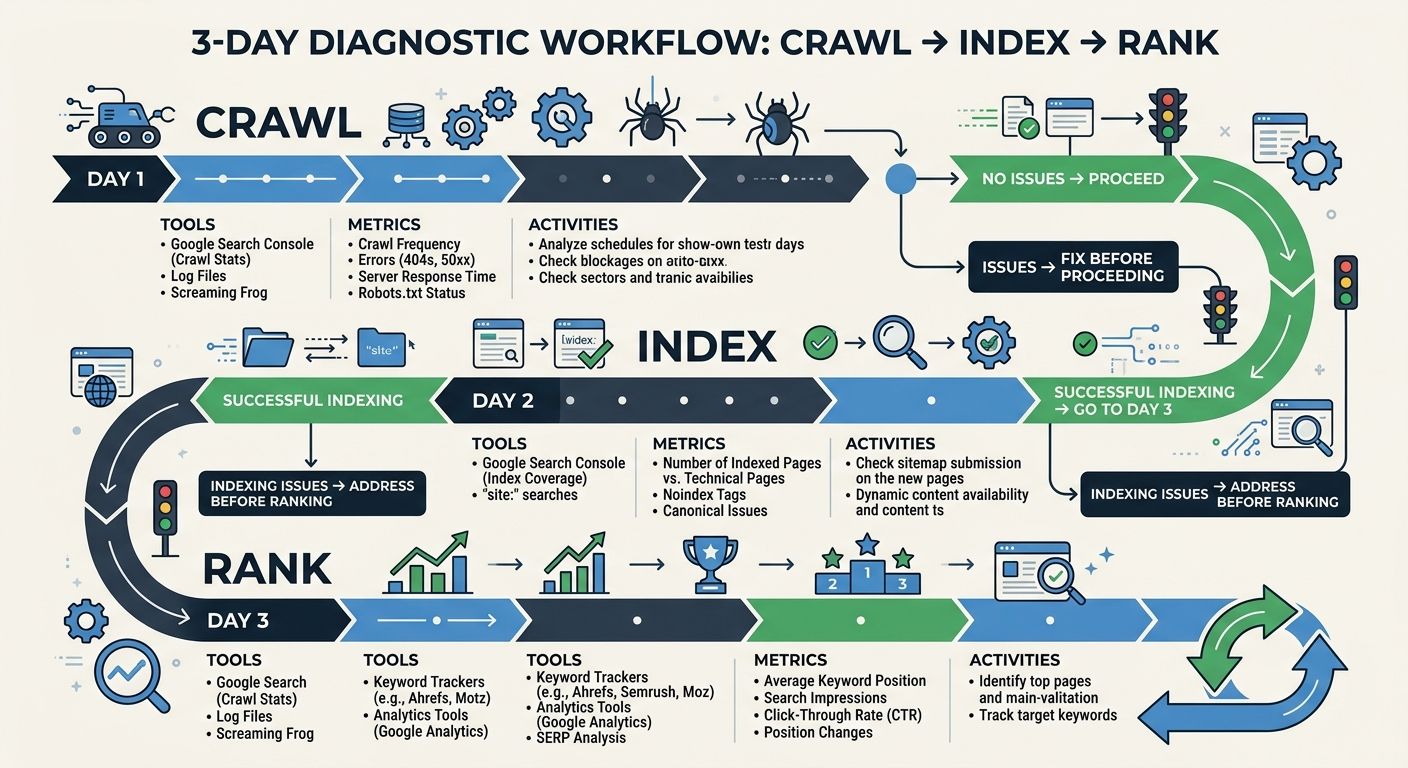
Applying the Crawl-Index-Rank Methodology to Real Drops
The crawl-index-rank methodology turns the pyramid into a repeatable diagnostic sequence. You check each layer in order, and you don't move to the next layer until the current one is confirmed healthy. Here's what that looks like against a real scenario:
Day 1 (Crawl Layer): Pull server logs for the 72 hours before the traffic decline started. Filter for Googlebot user agents. Look for spike in 5xx errors (anything above a 2% error rate is a red flag), sudden changes in crawl frequency (a 50%+ drop in daily Googlebot requests signals a crawl budget problem), and any new robots.txt rules deployed during that window.
Day 2 (Indexation Layer): Compare your sitemap URL count against the "Valid" count in Search Console's Pages report. Run a site:yourdomain.com search and compare the result count against your expected indexed page total. Check the URL Inspection Tool on 5 to 10 affected pages to confirm they're indexed and rendering correctly.
Day 3 (Content and Authority Layers): If layers 1 and 2 are clean, segment your Search Console performance data by query. Identify which specific queries lost impressions and clicks. Cross-reference those queries against SERP changes (new featured snippets, AI Overviews, competitor page updates). Run a diagnostic workflow for visibility drops on the top 20 affected URLs.
Pyramid Layer | Primary Tool | Key Metric | Healthy Threshold | Diagnosis Time |
|---|---|---|---|---|
Server/Crawl | Server logs, Screaming Frog | 5xx error rate during crawl windows | Below 2% | 2-4 hours |
Rendering | URL Inspection Tool, JS crawler | Indexation ratio (indexed ÷ submitted) | Above 90% | 4-8 hours |
Content Signals | Search Console, SERP analysis | Impression change by query cluster | Stable ±10% week-over-week | 1-2 days |
Authority | Backlink monitors, brand tracking | Referring domain count trend | No sudden loss of 10%+ domains | 1-2 days |
Competitive | Rank trackers, SERP feature monitors | Share of voice change | Stable ±5% monthly | Ongoing |
This is the SEO debugging framework in its most practical form. The entire sequence fits inside 48 hours of focused work for a site with under 100,000 pages. Larger sites need proportionally more time at the crawl layer because log file analysis scales linearly with page count.
Search Engine Land's proactive testing research recommends SEO split testing as a complement to reactive debugging. The process follows a hypothesis-driven structure: create a hypothesis, categorize control and variable page sets, implement changes on the variable group, and measure impact over 2 to 4 weeks. Teams that run proactive tests reduce their reactive debugging load by catching degradation before it reaches the crisis stage.
Where the Pyramid Breaks Down
The pyramid assumes a single root cause, and real sites often have compounding failures. A server migration that introduced 500ms of latency (layer 1) happening the same week as a core algorithm update (layer 3) produces a traffic drop that looks catastrophic but has two independent causes requiring two separate fixes. The crawl-index-rank methodology handles this by catching the infrastructure failure first, fixing it, then re-measuring before investigating higher layers. But teams under pressure from stakeholders demanding immediate answers often try to diagnose all layers simultaneously and end up fixing nothing well.
The second limitation is timing. Technical fixes at layers 1 and 2 (correcting robots.txt blocks, resolving canonical errors, fixing server response times) can produce visible recovery within 1 to 3 weeks once Google reprocesses the affected pages. Content and authority recovery at layers 3 and 4 takes 6 to 12 weeks because rebuilding topical relevance and trust requires Google to recrawl, re-evaluate, and re-rank across multiple update cycles. Teams that expect layer-1 recovery timelines from layer-3 fixes lose faith in the methodology and abandon it too early.
The third limitation is measurement. With Thrive Agency's research documenting crawl errors, blocked resources, broken redirects, poor Core Web Vitals, and mobile usability problems as the most common technical failure points, you'd think the diagnostic checklist would be straightforward. It's not, because many of these issues produce identical symptoms in surface-level analytics. A crawl error on 500 pages and a mobile usability failure on 500 different pages both show up as "organic traffic declined 15%." Only the pyramid's sequential approach separates them.
The framework works best when treated as a triage protocol rather than a complete diagnostic system. It tells you where to look first and prevents the most expensive mistake in organic traffic diagnostics: spending weeks optimizing content on pages that Googlebot can't even crawl. But it won't replace domain expertise, and it won't account for competitive shifts that require strategic repositioning rather than technical fixes. The pyramid gets you to the right layer. What you do once you're there still depends on the skill of the person holding the tools.
Marcus Webb
Digital marketing consultant and agency review specialist. With 12 years in the SEO industry, Marcus has worked with agencies of all sizes and brings an insider perspective to agency evaluations and selection strategies.
Related Articles

The SEO Debugging Workflow: A Framework for Diagnosing Visibility Drops in Under 48 Hours
A five-layer diagnostic sequence (crawl, render, index, rank, click) applied in strict dependency order isolates the root cause of organic visibility drops faster than any other method I've tested across 200+ agency evaluations.
The SEO Debugging Workflow: A Production Engineering Framework for Diagnosing Ranking Drops in Under 48 Hours
Five categories of technical error — missing schema markup, meta tag gaps, internal linking deficiencies, Core Web Vitals failures, and crawl budget waste — account for 82% of ranking suppression events across websites.
The Invisible SEO Audit: Fixing Hidden Technical Problems Before Rankings Improve
Fifty-six percent of companies now run AI-driven SEO monitoring to catch invisible technical problems in real time, according to 2026 marketing data.
Explore more topics