The Enterprise SEO Benchmarking Blindspot: Why Your 2026 Performance Dashboard Is Missing Critical Metrics
Fifty-eight percent of U.S. Google searches now end without a click to any external site, per SparkToro tracking data.
 Marcus Webb··9 min read
The Enterprise SEO Benchmarking Blindspot: Why Your 2026 Performance Dashboard Is Missing Critical Metrics
Fifty-eight percent of U.S. Google searches now end without a click to any external site, per SparkToro tracking data. Enterprise dashboards still built around organic sessions and keyword rankings are measuring a shrinking fraction of search influence, missing AI citation share, conversion-weighted visibility, and topic cluster performance that determine actual pipeline contribution.
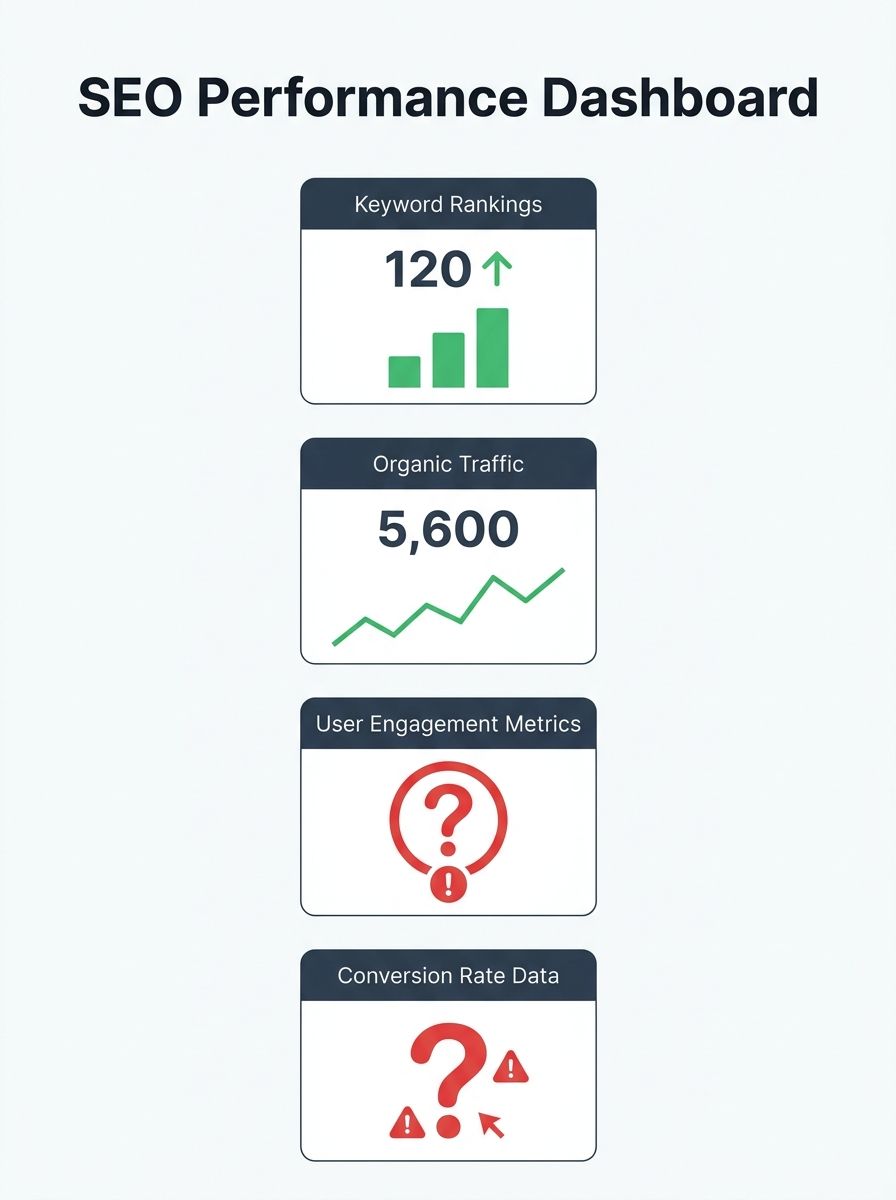
I've reviewed dashboards from over 40 enterprise SEO programs this year alone. The pattern is consistent: teams report organic sessions, average keyword position, and Domain Authority as their headline KPIs. These three metrics once correlated strongly with business outcomes. That correlation has weakened significantly as AI-generated search results, zero-click queries, and multi-platform discovery reshape how buyers interact with search. About 60% of all searches in 2026 are zero-click, with 26% of AI Overview results leading to no click versus 16% for traditional results.
The gap between what dashboards show and what drives revenue is the blindspot. Here are six rules for closing it.
Always weight visibility by conversion value, never by raw position count
The default enterprise report shows a table of keywords with their ranking positions, maybe color-coded green for improvements and red for declines. This tells you almost nothing about business impact. A keyword ranking #3 that converts at 0.2% and drives $400/month in pipeline is categorically less important than a keyword ranking #8 that converts at 6% and drives $28,000/month.
According to DashThis benchmarks for 2026, healthy conversion rates range from 2% to 5% for B2B SaaS blog pages, while tool comparison and pricing pages can hit 8% or higher. Top-of-funnel content typically converts between 0.5% and 2%. These ranges mean the conversion-focused SEO KPIs on your dashboard need to multiply visibility scores by actual business value per query.
The formula is straightforward: take your position-weighted impression share for a query, multiply it by that query's conversion rate and average deal value (or order value for e-commerce), then sum across all tracked queries. This gives you a single number, conversion-weighted visibility, that moves when your SEO effort actually affects revenue. Raw position counts can improve while this number declines, and that divergence is exactly the blindspot most dashboards hide.
I'd propose calling this the Influence-to-Pipeline Score: conversion-weighted visibility plus AI citation share, indexed against your top three competitors. It gives you a single composite metric that answers whether your SEO program is building pipeline, not whether it's generating green arrows in a ranking report.
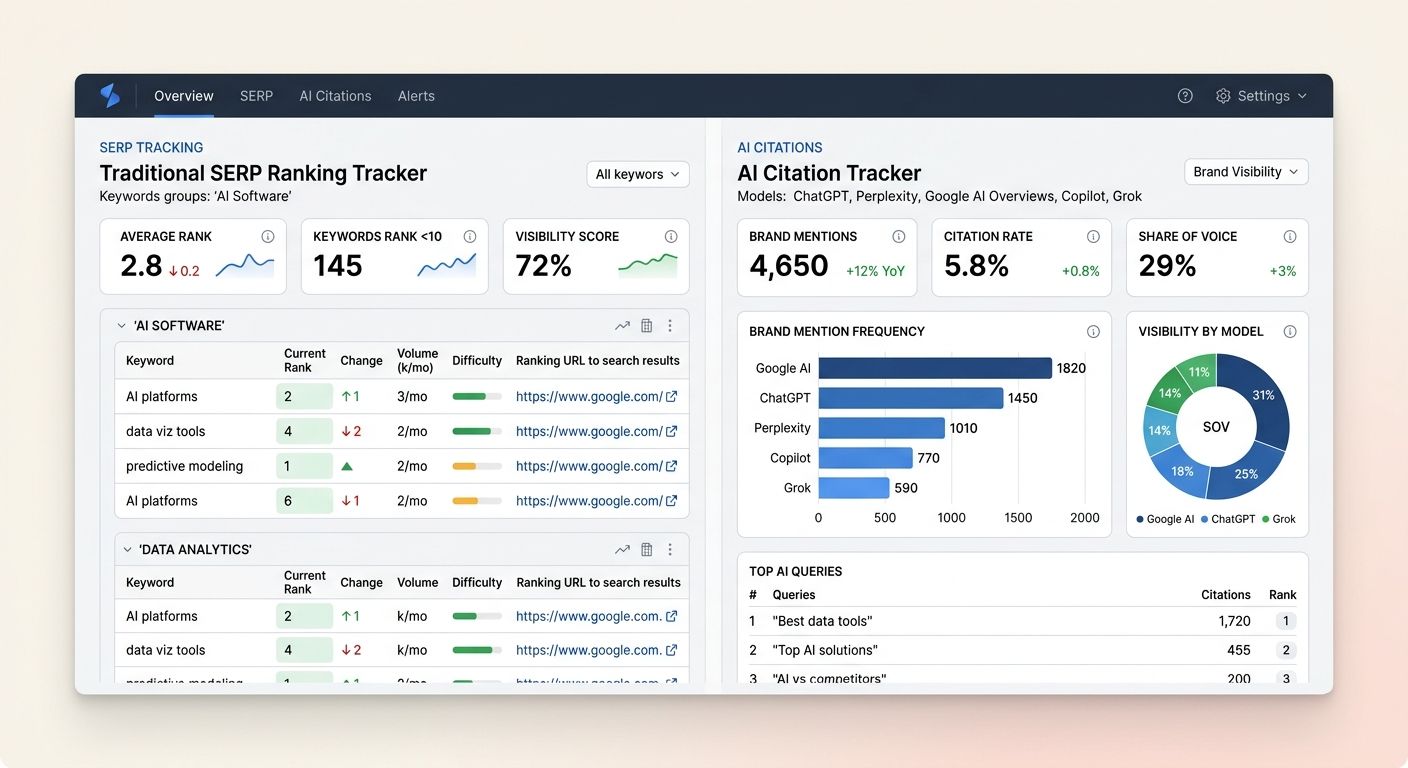
Track AI citation share with the same rigor you track SERP rankings
When AI Overviews appear in Google results, CTR drops from roughly 15% to 8%. With 700 million weekly ChatGPT users performing search-like queries and 94% of B2B buyers using LLMs during their buying process (per 6sense research), a massive share of your audience discovers information through channels that never register in Google Analytics. And 24% of CMOs now use AI tools like ChatGPT specifically for vendor research, according to Wynter data.
Your dashboard needs a dedicated AI visibility panel. The practical approach: build a prompt panel of 50 to 100 queries relevant to your product or service, then test weekly across ChatGPT, Perplexity, Google AI Overviews, Copilot, and Grok. Track four things for each:
Brand mention frequency across platforms
Source citation rate (how often your content is linked)
Recommendation context (positive, neutral, or negative framing)
Share of voice against named competitors
Princeton's 2024 KDD study on generative engine optimization found that citing sources increased citation impact by 40%, adding specific statistics boosted it by 37%, and including expert quotes lifted it by 30%. Keyword stuffing, by contrast, decreased citation visibility by 10%. These findings have held through 2026, and they point to a meaningful shift in content strategy: the content that performs in AI engines prioritizes specificity and attribution over keyword density.
Google's own guidance, as covered in their official AI search documentation, confirms that traditional ranking signals feed AI-generated results. But the relationship between organic rankings and AI citations is indirect enough that you need separate measurement for each.
Benchmark against your industry vertical, not universal averages
An e-commerce company comparing its 3.1% organic CTR against a universal benchmark of 2.8% might feel satisfied. But Zero Gravity Marketing's industry benchmarking report shows that CTR, traffic patterns, and ranking distributions vary dramatically by sector. Finance sites, healthcare publishers, and SaaS companies operate in fundamentally different competitive environments with different SERP feature distributions, different query intent profiles, and different user behavior patterns.
ClickRank's 2026 SEO benchmarks make this point explicitly: SEO performance benchmarking by industry requires competitor context. Before setting a single KPI for the quarter, pull your top three competitors into a tool like Ahrefs Site Explorer and compare referring domains, organic traffic share, and keyword overlap. Your targets should reflect where you stand relative to direct competitors in your vertical, not where you stand relative to a blended average that includes industries with completely different dynamics.
This applies to enterprise SEO metrics across the board. A SaaS company tracking conversion rates should benchmark against other SaaS companies (where 2% to 5% is healthy for blog content), not against media publishers where conversion tracking means something entirely different. I've watched enterprise teams celebrate "above average" performance that was actually bottom-quartile for their specific vertical because nobody segmented the benchmarks. Our earlier deep-dive on building your 2026 benchmarking dashboard walks through the setup process in detail.
Report on a quarterly cadence tied to revenue, not monthly traffic snapshots
Monthly reports have a role. TapClicks recommends monthly reviews for tracking SERP positions, site traffic, and revenue impact together, since monthly timeframes give search engines enough time to process content updates, technical fixes, and internal linking changes. But the monthly cadence becomes a problem when it's the primary lens for executive reporting, because SEO impact compounds over quarters, not weeks.
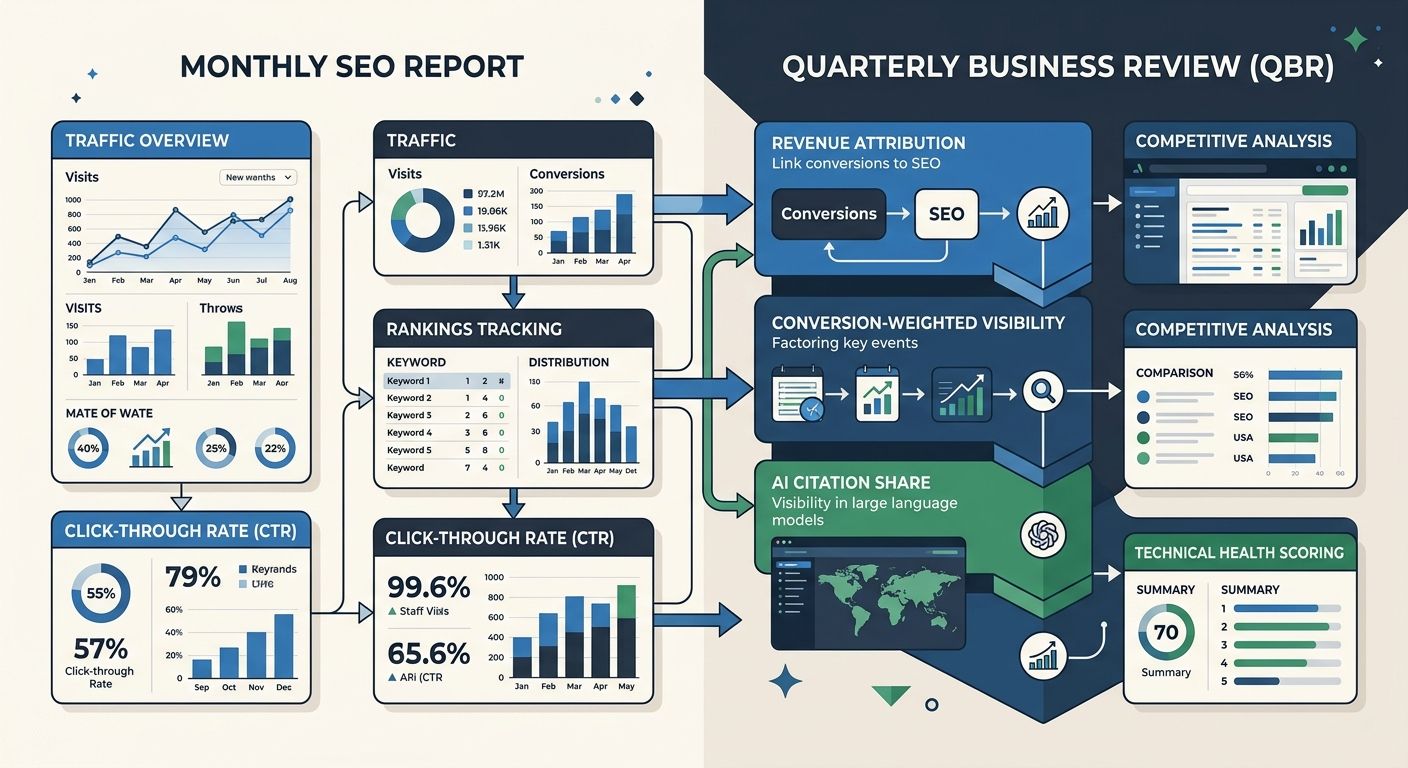
Digital Ring's reporting best practices guide lays out the right structure: monthly deep dives review concurrent indicators like traffic patterns, engagement, and click-through rates to spot trends before they become problems. Quarterly business reviews measure what actually matters: conversions, revenue, and ROI.
Your quarterly SEO reporting framework should include five components:
Organic revenue attribution (beyond traffic counts)
Conversion-weighted visibility trend (beyond ranking snapshots)
AI citation share movement across tracked platforms
Competitive gap analysis by vertical
Technical health score with pass-rate benchmarks
The enterprise ROI timeline reinforces why quarterly matters: enterprise SEO typically reaches 3x ROI at 24 months, 8x at 36 months, and up to 35x at 60 months. Monthly traffic fluctuations are noise within that trajectory. Quarterly reporting forces the conversation toward trend lines and business contribution instead of reacting to 4-week dips that mean nothing. When B2B agencies are rebuilding strategy beyond traditional SERP rankings, the quarterly review is where that strategic evolution gets measured and validated.
Audit technical pass rates before celebrating content wins
Content performance means nothing if your technical infrastructure is failing silently. Enterprise sites with thousands or tens of thousands of pages are especially vulnerable to crawl coverage gaps, redirect chains, and Core Web Vitals degradation that suppress the impact of otherwise strong content.
The 2026 enterprise technical benchmarks are specific. Here's what your dashboard should track:
Technical Metric | Target Threshold | Excellent Threshold |
|---|---|---|
Core Web Vitals pass rate | 80%+ of URLs "Good" | 95%+ |
Crawl coverage (within 30 days) | 80%+ of pages | 95%+ |
Internal link depth to key pages | Under 4 clicks | Under 3 clicks |
Duplicate content rate | Under 10% | Under 5% |
Redirect chain steps | Under 2 | 0 |
Mobile usability errors | Under 0.2% of pages | 0% |
Google's Interaction to Next Paint (INP) metric remains a confirmed ranking signal, which means enterprise teams need automated regression testing built into their deployment pipelines. And sites with proper schema markup achieve 15% to 25% higher CTR from rich results. If your dashboard doesn't track schema coverage and validation errors alongside content metrics, you're missing a direct revenue lever.
We've covered the technical infrastructure tasks agencies frequently miss in a previous breakdown, and the pattern holds at enterprise scale: teams invest in content creation while technical debt quietly erodes the return. Enterprise SEO platforms like BrightEdge, Conductor, and Botify are purpose-built for this kind of ongoing technical monitoring, and Search Engine Journal's guidance on enterprise conversion tracking highlights that even imperfect tracking implementations provide value when combined with Google Tag Manager and call tracking rules of engagement.
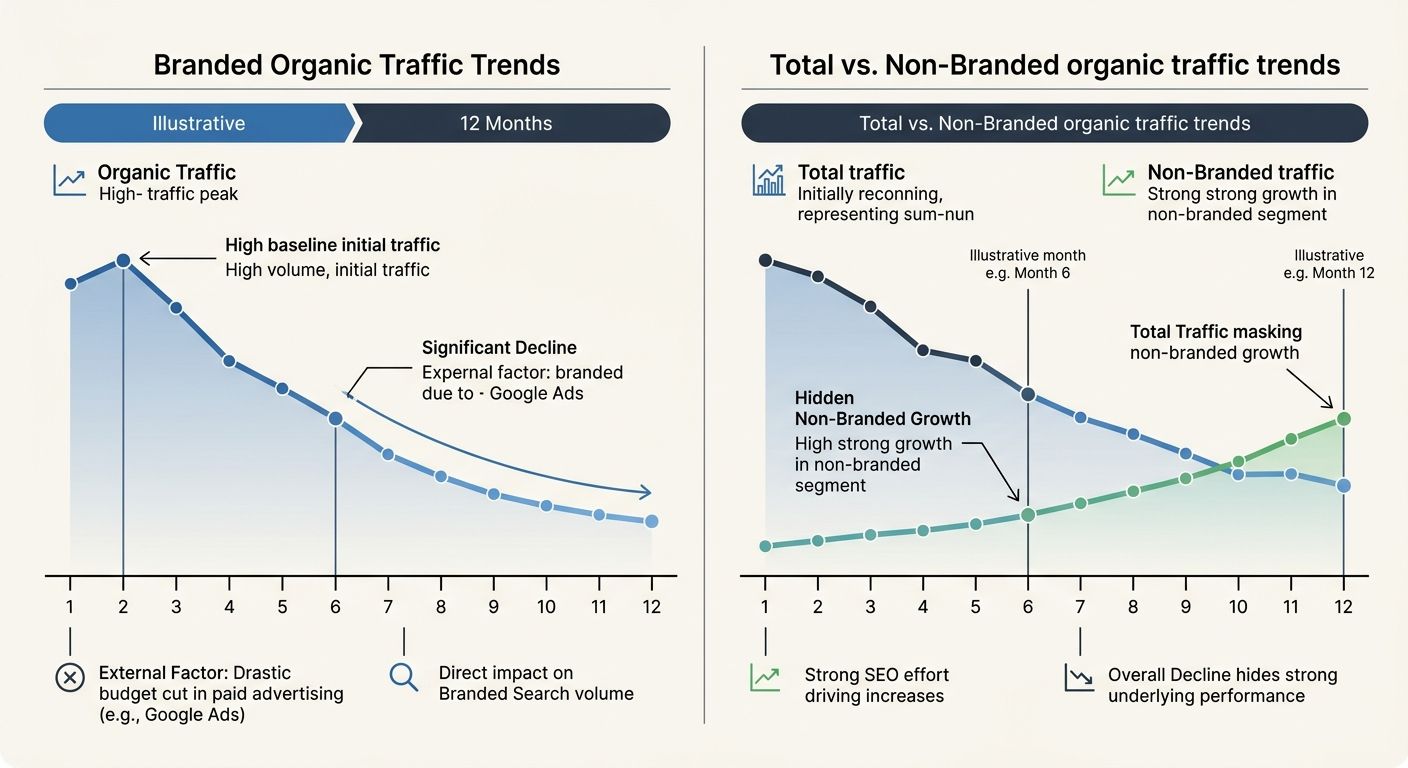
Separate branded from non-branded search in every single report
This rule catches more dashboard blindspots than any other metric adjustment I recommend. Branded search (queries containing your company name, product names, or close variants) and non-branded search (generic category and problem-focused queries) represent fundamentally different user intents, competitive dynamics, and attribution logic. Lumping them into a single "organic traffic" number hides the real story.
A 20% increase in organic traffic driven entirely by branded search growth might mean your PR team or paid media campaigns are working, not your SEO program. A 5% decline in total organic traffic that masks a 15% increase in non-branded traffic might actually represent your best SEO quarter ever. Without segmentation, you can't tell the difference, and you'll misallocate budget based on misleading signals.
This segmentation also connects directly to AI visibility. Users who discover your brand through ChatGPT or Perplexity often search your brand name directly afterward, which means branded search volume can serve as a proxy metric for AI influence. But you can only use it that way if you're tracking it separately and correlating it against your AI citation panel data.
Every quarterly business review should show branded and non-branded trends on separate lines. The expanded ranking pool changes Google has been rolling out affect non-branded queries disproportionately, since they introduce new competitors into SERPs where your position was previously stable. Blended signals will lead to misdiagnosis every time.
When These Rules Break Down
These six rules assume a certain organizational maturity: dedicated analytics infrastructure, access to conversion data, and a quarterly reporting cadence that reaches decision-makers. When those prerequisites don't exist, the rules need modification.
Early-stage enterprise SEO programs (first 6 to 12 months) often lack enough conversion data to build conversion-weighted visibility scores. In that phase, raw traffic and ranking data are acceptable proxies, with the explicit understanding that they'll be replaced as the program matures. The danger is treating those proxy metrics as permanent KPIs, which is exactly how dashboards get stuck measuring 2023 search behavior with 2026 tooling.
Companies in industries where AI search adoption remains low (certain manufacturing verticals, highly regulated sectors with restricted information flows) can deprioritize AI citation tracking and shift that measurement effort toward technical pass rates and schema coverage, where the ROI is more immediate. The manufacturing SEO conversion gap is a real phenomenon, and the dashboard adjustments for those verticals look different than for SaaS or e-commerce.
And if your organization reports to stakeholders who don't understand conversion-weighted visibility or AI citation share, you'll need a translation layer. Keep the sophisticated metrics in your working dashboard, but present them as pipeline contribution and competitive position in executive summaries. The metrics still matter. The vocabulary changes depending on who's reading the slide.
Every enterprise dashboard was designed to measure something specific at a specific moment in search history. The problem is that most were designed when organic sessions and keyword rankings reliably predicted business outcomes. Search has moved well past that era. These six rules update the measurement layer to match, and the organizations that adopt them first will carry a structural advantage into every quarterly planning cycle that follows.
Marcus Webb
Digital marketing consultant and agency review specialist. With 12 years in the SEO industry, Marcus has worked with agencies of all sizes and brings an insider perspective to agency evaluations and selection strategies.
Related Articles
The SEO Benchmarking Audit: Building Your 2026 Performance Dashboard Against Industry Standards
Three agencies pitched the same mid-market SaaS company in January 2026, and each one submitted a "performance dashboard" as proof of their methodology. I reviewed all three as part of an agency selection engagement. Dashboard A tracked 47 metrics with no benchmarks.

How to Build a Transparent SEO Reporting Dashboard Your Clients Will Actually Trust in 2026
Sixty-eight percent of customers leave a company because they believe the company doesn't care about them, according to Vendasta's client reporting research. In agency SEO, that perception of indifference almost always traces back to one artifact: the monthly report.

The SEO Agency Trust Verification Framework: Auditing Real Results Beyond Monthly Reports
Verifying an SEO agency's real performance requires auditing three things their monthly reports rarely show: revenue attribution from organic search, ranking movement on terms that actually convert, and independent third-party traffic validation.
Explore more topics