The SEO Benchmarking Audit: Building Your 2026 Performance Dashboard Against Industry Standards
Three agencies pitched the same mid-market SaaS company in January 2026, and each one submitted a "performance dashboard" as proof of their methodology. I reviewed all three as part of an agency selection engagement. Dashboard A tracked 47 metrics with no benchmarks.
 Marcus Webb··9 min read
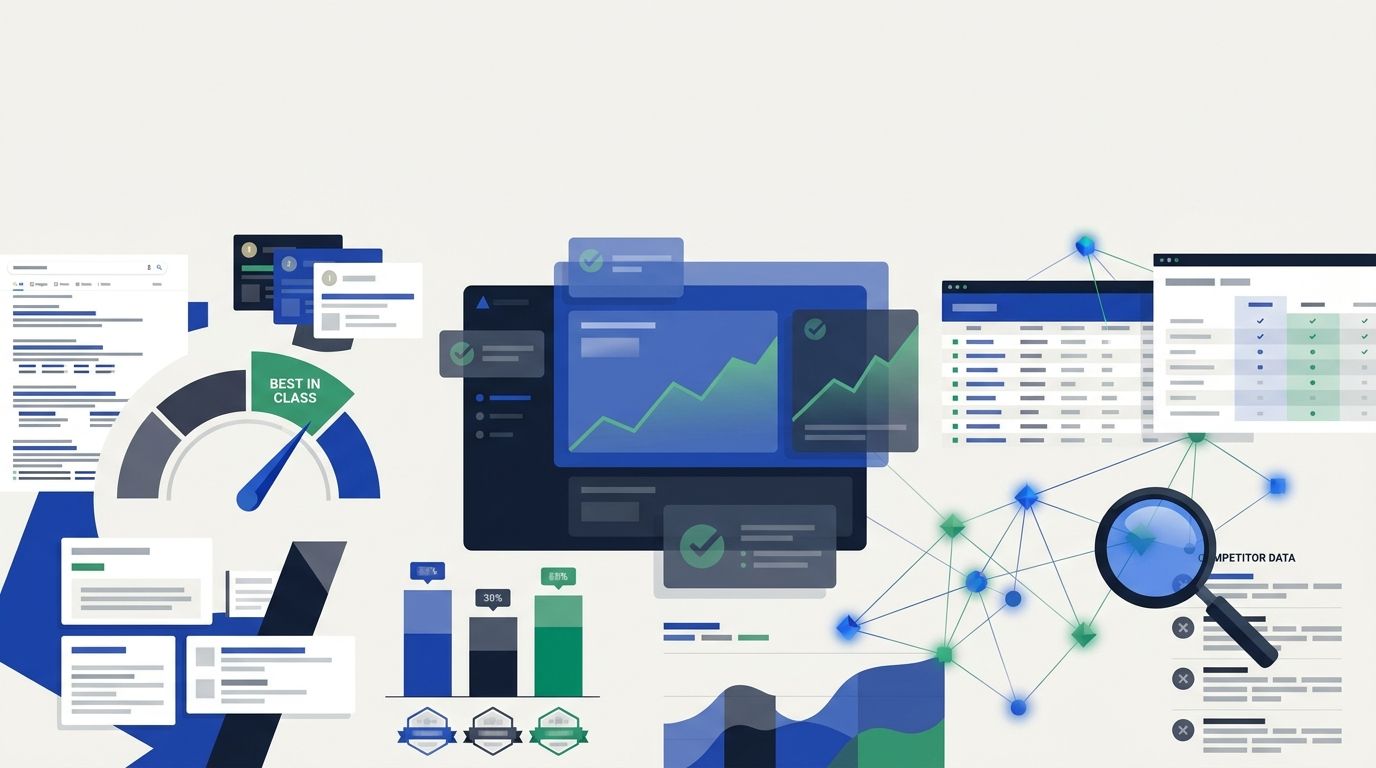
The SEO Benchmarking Audit: Building Your 2026 Performance Dashboard Against Industry Standards
Three agencies pitched the same mid-market SaaS company in January 2026, and each one submitted a "performance dashboard" as proof of their methodology. I reviewed all three as part of an agency selection engagement. Dashboard A tracked 47 metrics with no benchmarks. Dashboard B had benchmarks sourced from a 2023 Backlinko study that predated AI Overviews entirely. Dashboard C displayed four metrics, each tied to current industry standard metrics 2026 data, with gap analysis built into every row. The client hired Agency C at $8,500/month. The other two weren't in contention after the first call.
That gap between "lots of numbers" and "the right numbers in context" is what separates useful SEO performance benchmarking from the decorative dashboards most agencies hand over on monthly reporting calls. I've evaluated north of 200 agencies at this point, and the dashboard question is where roughly 70% of them reveal they're operating on autopilot.
This piece walks through how a custom KPI dashboard should actually get built, step by step, following the sequence I use when constructing one for clients during agency evaluations and competitive SEO analysis framework reviews.
Pulling Your Baseline From Search Console and GA4
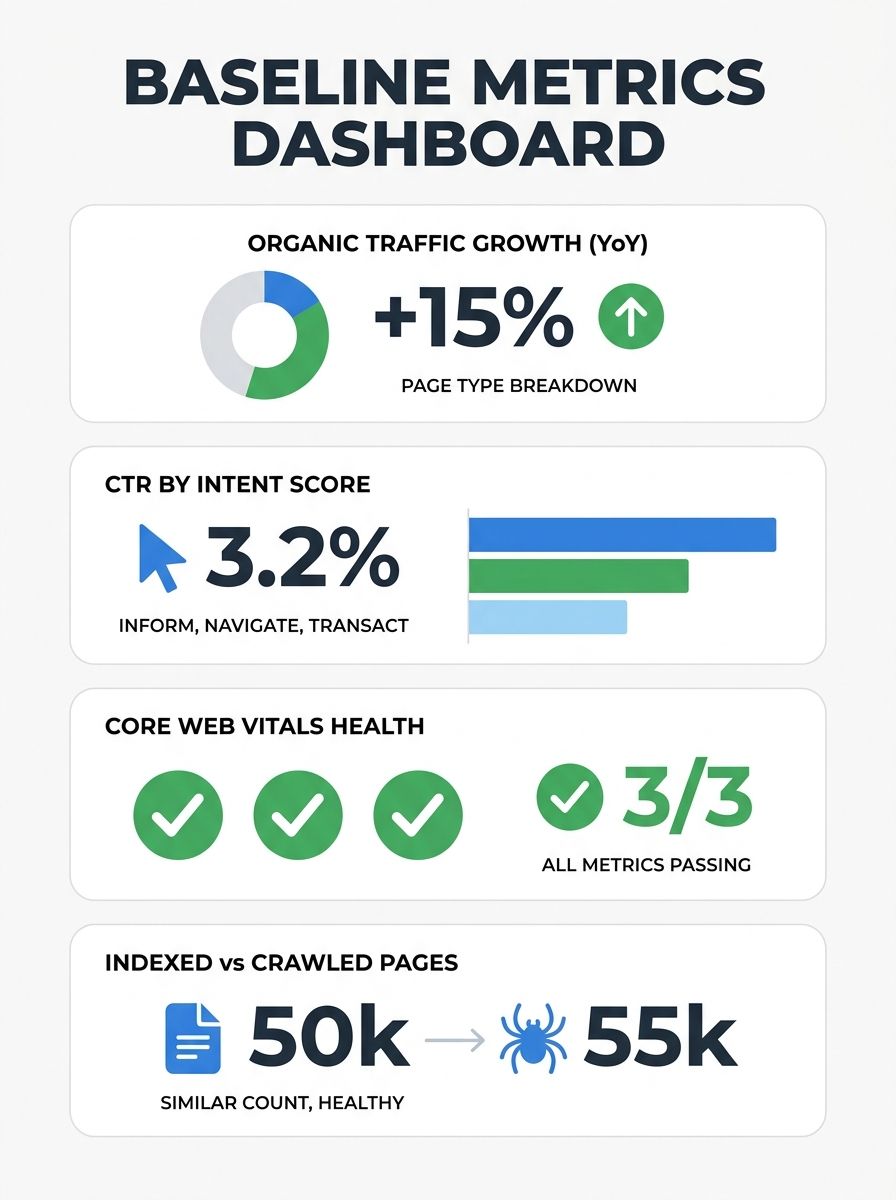
Every benchmarking dashboard starts with your own data, not industry averages. The industry numbers come second. If you layer benchmarks on top of metrics you don't fully trust, you're just decorating garbage.
The baseline pull should include at least four months of data from Google Search Console and GA4. Four months gives you enough variance to account for algorithm fluctuations, seasonal shifts, and content publishing cadence. Two months isn't enough. Twelve months introduces so much noise that you'll spend more time explaining anomalies than building the dashboard.
Here's what goes into the baseline:
Organic traffic by page type: Product pages, landing pages, blog content, and support/documentation pages should each have separate traffic totals. As Promodo's 2026 benchmarking research recommends, you should set separate baselines for each page type and traffic source combination, because a 3% conversion rate on a product page means something completely different than 3% on a blog post.
Click-through rate by query intent group: Don't average CTR across your entire site. Break it into branded, informational, commercial, and transactional query buckets. Position 1 captures roughly 27.6% of organic clicks on average, but that number swings wildly depending on whether AI Overviews are present in the SERP.
Core Web Vitals scores: LCP under 2.5 seconds, INP under 200 milliseconds, CLS under 0.1. Pull these from CrUX data, not lab tests. The CrUX score is what matters for SEO, since it represents real user experience over a 28-day window.
Indexed page count versus crawled page count: A mismatch here signals crawl budget waste or indexing issues that will undermine everything else you measure.
If your agency can't produce this baseline within 48 hours of getting access to your accounts, that tells you something about their operational discipline. I covered how technical infrastructure gaps create exactly this kind of bottleneck in a separate piece, and it applies directly here.
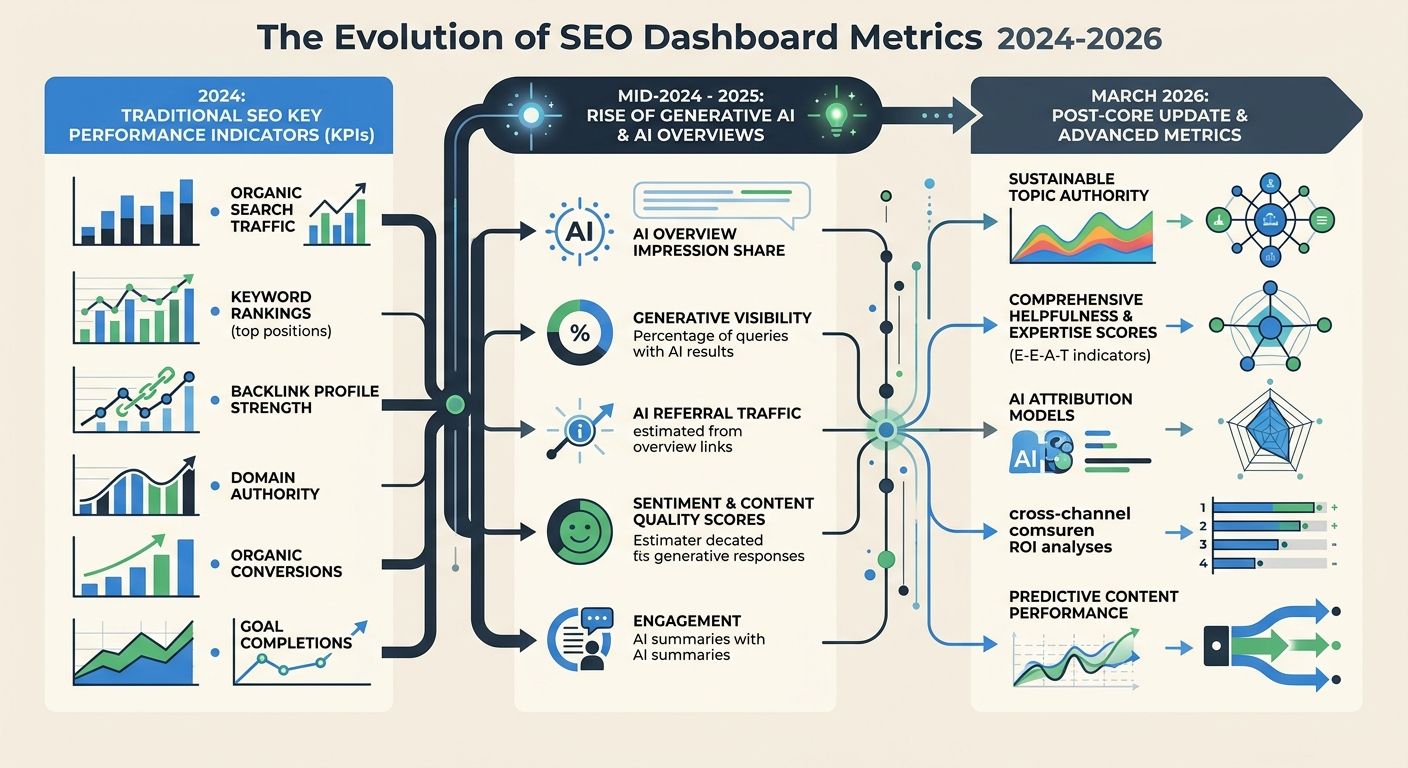
When AI Overviews Forced a Second Layer of Tracking
The baseline metrics above would have been sufficient for a benchmarking dashboard through most of 2024. Then AI Overviews started appearing in 25.8% of all searches, climbing to 51.6% in health-related queries and 65.9% for long informational queries according to WebFX's 2026 benchmark data. That shift didn't destroy organic traffic overnight, but it fundamentally changed what "good performance" looks like for informational content.
The March 2026 Core Update accelerated this. Fifty-five percent of monitored websites saw ranking movement, and sites with weak E-E-A-T signals dropped an average of eight positions. Pages without clear author attribution got hit hardest. And ChatGPT started pulling 38-40% of its citations from top-10 Google results, which meant your traditional ranking strength suddenly influenced whether you showed up in AI-generated answers too.
So the dashboard needed a second layer. Here's what that layer includes:
AI citation frequency: How often your domain appears in responses from ChatGPT, Perplexity, and Google's AI Mode. This metric is still immature compared to traditional SEO tracking, but tools like ClickRank are building monitoring for it. Pages not updated within 90 days lose citation eligibility faster, per their 2026 benchmarking analysis.
Share of model: What percentage of AI-generated answers in your topic area reference your content versus competitors. Think of it as share of voice, but for generative search.
Content freshness decay rate: AI-cited sources rotate 40-60% month-to-month. If you're tracking which pages get cited and when they stop, you can predict when a refresh is needed before you lose the citation slot.
The agencies I evaluate that still don't track AI visibility metrics are operating with a blind spot that grows wider every quarter. If you're trying to understand how AI-driven search is reshaping the agency landscape, the benchmarking dashboard is where that shift becomes measurable instead of theoretical.
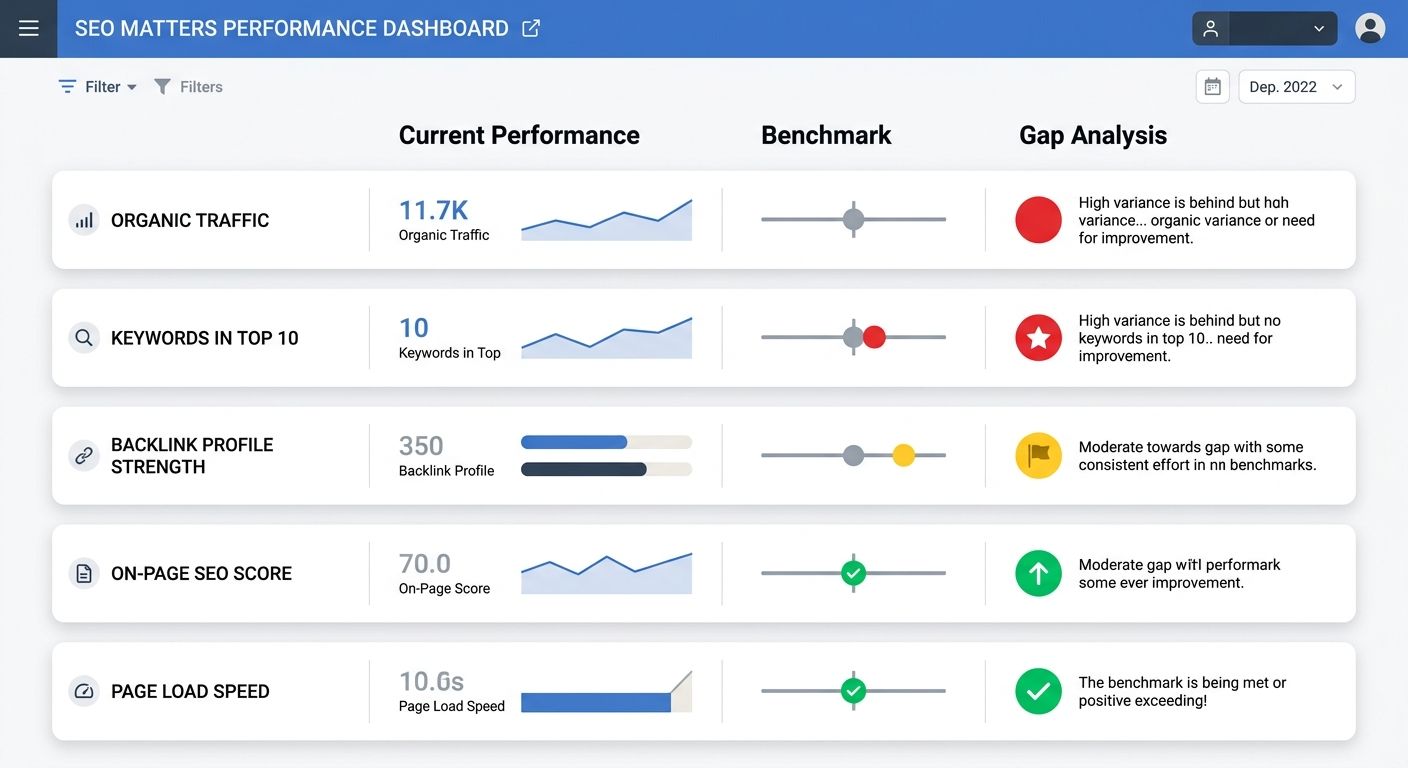
Assembling the Three-Column Gap Format
This is where the dashboard goes from a data dump to something you can actually make decisions with. The format I recommend to every client is dead simple: three columns per metric showing Benchmark, Current Score, and Gap.
ClickRank's benchmarking framework uses this exact structure, and it works because it forces you to answer a question that raw metrics never do: "Compared to what?"
Here's how the columns work in practice for five core metrics:
Metric | Industry Benchmark | Your Score | Gap |
|---|---|---|---|
Organic CTR (Position 1) | 27.6% | 19.2% | -8.4% |
LCP (75th percentile mobile) | < 2.5s | 3.1s | +0.6s |
Referring domains (Position 1 target) | ~365 | 142 | -223 |
Content word count (informational) | 1,750 avg | 1,100 avg | -650 words |
AI citation rate (monthly) | Track baseline | 0 (not tracking) | Unknown |
The "Gap" column is what turns a report into a prioritization tool. A client of mine in the legal space saw a -223 referring domain gap and initially panicked. But when we segmented by page type, their practice area landing pages actually had competitive backlink profiles. The gap was concentrated entirely in their blog content, which had never been part of their link building strategy. That changes the conversation from "we need 223 more links" to "we need to restructure our content promotion for one specific section of the site."
For agencies billing $3,000-$15,000/month, I expect this gap analysis to be included in every quarterly report. If your agency presents traffic graphs without benchmark context, you're paying for a weather report when you need a navigation chart.
Adding Competitor Benchmarks Without Drowning in Data
The industry-level benchmarks give you a general target. Competitor benchmarks tell you specifically who you need to overtake and where the openings exist. But I've watched dozens of agencies turn the competitive analysis phase into a research project that takes six weeks and produces a 40-page PDF nobody reads.
The competitive SEO analysis framework that actually works is constrained by design. You pick three to five competitors, and you track them across the same metrics in your gap analysis. That's it.
The critical step most teams skip: identifying the right competitors. As Frase's competitive analysis research points out, your true SEO competitors aren't always who you think they are. Your business competitors and your SERP competitors often diverge significantly. A mid-size accounting firm might consider other mid-size firms as competitors, but in the SERPs, they're competing against NerdWallet, Investopedia, and IRS.gov for informational queries.
Here's the workflow I use:
Export your top 50 non-branded keywords from Search Console
Run each keyword through Ahrefs or Semrush and record which domains appear in positions 1-5
Tally frequency. The domains that appear most often across your keyword set are your actual SERP competitors
Pull their Core Web Vitals via CrUX, their backlink profiles, their content depth metrics, and their estimated organic traffic
Then plug those numbers into your dashboard as additional benchmark columns. Search Engine Land's analysis of how competitor organic traffic patterns reveal strategy found that some competitors rank well primarily through topical relevance and on-page optimization rather than link equity. When that's the case, the keyword gaps you identify are likely winnable through content improvements rather than expensive link campaigns.
As Yoast's benchmarking guide notes, when all visible factors seem equivalent between you and a competitor, the difference often comes down to link quality and relevance. Tools like Semrush and Ahrefs make this comparison straightforward, but only if you've already narrowed your competitor set instead of trying to analyze everyone.
This competitive layer is where I've seen agencies charge $2,000-$5,000 as a standalone deliverable. It's worth paying for once if done well, but the ongoing tracking should fold into your monthly dashboard at no additional cost. Any agency that charges separately for competitor monitoring every month is double-dipping. If you're evaluating how recognition and authority signals stack up against raw ranking metrics, the competitor benchmark layer is where that comparison becomes concrete.
Wiring the Dashboard Into a Living System
A static report created once per quarter isn't a dashboard. A dashboard updates, alerts, and surfaces problems before they become visible in traffic graphs. The distinction matters because SEO benchmarking only works when the data stays current enough to act on.
For most sites, I recommend one of two approaches depending on scale:
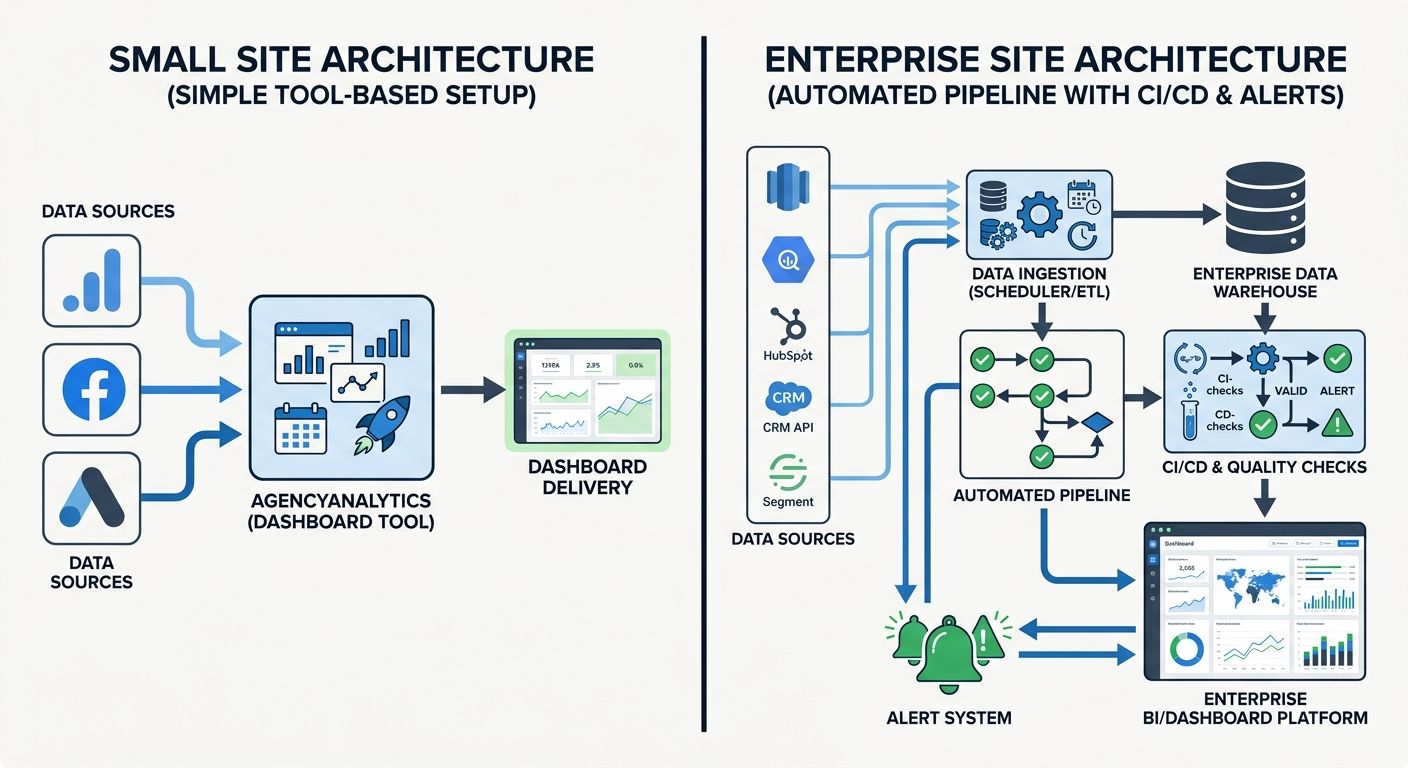
For sites under 10,000 pages: A tool like AgencyAnalytics can centralize your KPIs by pulling data from Search Console, GA4, PageSpeed Insights, and third-party rank trackers into a single view. Their Google PageSpeed integration monitors load time, performance score, and Core Web Vitals alongside organic metrics. Pricing typically runs $75-$300/month depending on client count, which is reasonable for small to mid-size operations. Whatagraph offers similar functionality with more emphasis on visual customization for client-facing reports.
For sites over 100,000 pages: You'll need automated pipelines. Enterprise SEO teams in 2026 are running CI/CD-style checks on their technical SEO the same way engineering teams run code tests before deployment. Automated crawls catch indexing regressions within hours instead of weeks. If your site is large enough to need this, and your agency doesn't mention automation during the pitch, they probably don't operate at the scale your site requires.
Regardless of which approach fits, your custom KPI dashboard should refresh weekly at minimum, with automated alerts for three conditions:
Core Web Vitals crossing the "needs improvement" threshold
Organic CTR dropping more than 15% for any intent category week-over-week
A tracked competitor gaining more than 5 positions on a target keyword cluster
The alert thresholds will need calibration during the first month. Set them too tight and you'll get noise from normal SERP fluctuation. Set them too loose and you'll miss the early signals of a real problem. I typically start with aggressive thresholds and loosen them after the first four weeks of data. For diagnosing the problems those alerts surface, the framework for investigating visibility drops in under 48 hours pairs directly with this monitoring setup.
Where the Data Looks Today
The SEO performance benchmarking landscape in 2026 sits in an uncomfortable middle ground. Traditional metrics still matter enormously for ranking and traffic. AI visibility metrics matter increasingly for discoverability but lack the measurement maturity and standardization that traditional SEO tools have built over fifteen years. Content quality signals like E-E-A-T have moved from "nice to have" recommendations to measurable ranking factors that the March Core Update enforced with real consequences.
The dashboard you build today will look different twelve months from now. AI citation tracking tools are primitive compared to where rank tracking was even five years ago, and the benchmarks for AI visibility are still being established rather than settled. That's fine. Building the tracking infrastructure now means you'll have historical data when those benchmarks do stabilize, and your competitors who waited will be starting from zero.
The agencies and in-house teams I see doing this well share three characteristics. They segment everything by page type and intent instead of reporting site-wide averages. They benchmark against specific SERP competitors rather than abstract industry figures. And they treat the dashboard as operational infrastructure that drives weekly decisions, not as a monthly PDF that gets skimmed in a meeting and forgotten.
If your current reporting doesn't show you where you stand against documented industry benchmarks and identified competitors, with a clear gap column that tells you exactly what to prioritize, then you're spending money on SEO without a feedback loop. And SEO without a feedback loop is just hope with a retainer attached.
Marcus Webb
Digital marketing consultant and agency review specialist. With 12 years in the SEO industry, Marcus has worked with agencies of all sizes and brings an insider perspective to agency evaluations and selection strategies.
Related Articles
The Enterprise SEO Benchmarking Blindspot: Why Your 2026 Performance Dashboard Is Missing Critical Metrics
Fifty-eight percent of U.S. Google searches now end without a click to any external site, per SparkToro tracking data.

The SEO Agency Trust Verification Framework: Auditing Real Results Beyond Monthly Reports
Verifying an SEO agency's real performance requires auditing three things their monthly reports rarely show: revenue attribution from organic search, ranking movement on terms that actually convert, and independent third-party traffic validation.

How to Build a Transparent SEO Reporting Dashboard Your Clients Will Actually Trust in 2026
Sixty-eight percent of customers leave a company because they believe the company doesn't care about them, according to Vendasta's client reporting research. In agency SEO, that perception of indifference almost always traces back to one artifact: the monthly report.
Explore more topics