
How to Build a Transparent SEO Reporting Dashboard Your Clients Will Actually Trust in 2026
Sixty-eight percent of customers leave a company because they believe the company doesn't care about them, according to Vendasta's client reporting research. In agency SEO, that perception of indifference almost always traces back to one artifact: the monthly report.
 Marcus Webb··8 min read
How to Build a Transparent SEO Reporting Dashboard Your Clients Will Actually Trust
Sixty-eight percent of customers leave a company because they believe the company doesn't care about them, according to Vendasta's client reporting research. In agency SEO, that perception of indifference almost always traces back to one artifact: the monthly report. Building a dashboard around agency dashboard transparency and business-aligned KPIs reverses the churn pattern.
When Monthly PDFs Became the Problem
The standard agency reporting model through 2023 and 2024 worked like this: an SEO team would pull data from Google Search Console, run a keyword ranking export, stitch together some screenshots, and email a 15-page PDF to the client on the first Monday of each month. The client would open it, scan the first page, and close it. Engagement with the full document hovered somewhere near zero.
The problem wasn't laziness on the client's part. The problem was that these PDFs answered questions nobody was asking. A 47-row keyword ranking table tells a client nothing about whether their investment is generating revenue. An organic traffic graph with no conversion attribution looks identical whether the agency is driving qualified buyers or attracting irrelevant blog traffic from another continent.
As AgencyAnalytics noted in their guide to transparent agency-client relationships, "Trust is earned, not given. By providing your clients with accurate, shared reporting," agencies reduce ambiguity and build the foundation for long-term retention. The agencies that figured this out early gained a structural retention advantage. The agencies that kept emailing PDFs kept losing clients at renewal.
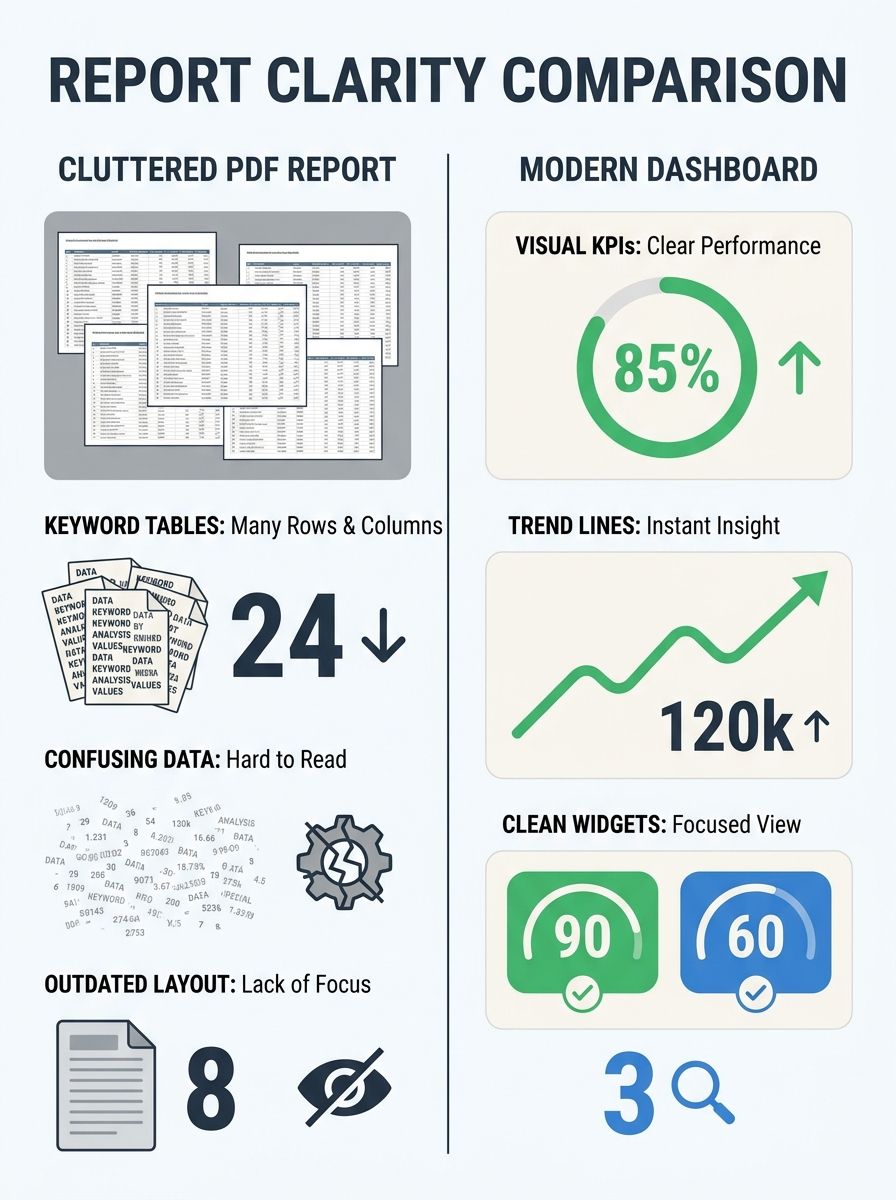
Manual report creation was also consuming 4 to 8 hours per client monthly, according to industry analysis. That's non-billable time that could be redirected toward actual strategy. And the irony is that all those hours produced a document clients barely read.
I've reviewed over 200 agency operations at this point in my career, and the pattern repeats with remarkable consistency: agencies that invest heavily in execution but treat reporting as an afterthought lose clients to agencies with mediocre execution and excellent reporting. The dashboard is the relationship. If you haven't revisited how you handle enterprise-level performance benchmarking, the problem is probably worse than you think.
Picking the Right KPIs (And Killing the Vanity Metrics)
A working SEO KPI framework for 2026 starts with one question: what did the client hire you to accomplish? If the answer is "generate more qualified leads from organic search," then every metric on the dashboard should trace back to qualified leads. If the answer is "increase e-commerce revenue from non-branded organic queries," then every metric should trace back to that revenue number.
Reportr Agency's 2026 guide on transparent SEO reporting states that transparent reports "measure progress against specific, agreed-upon objectives, not generic metrics. If you promised to increase qualified leads from organic search, show progress toward qualified leads, not traffic volume." This is the single most common failure I see in agency dashboards: the metrics don't match the contract.
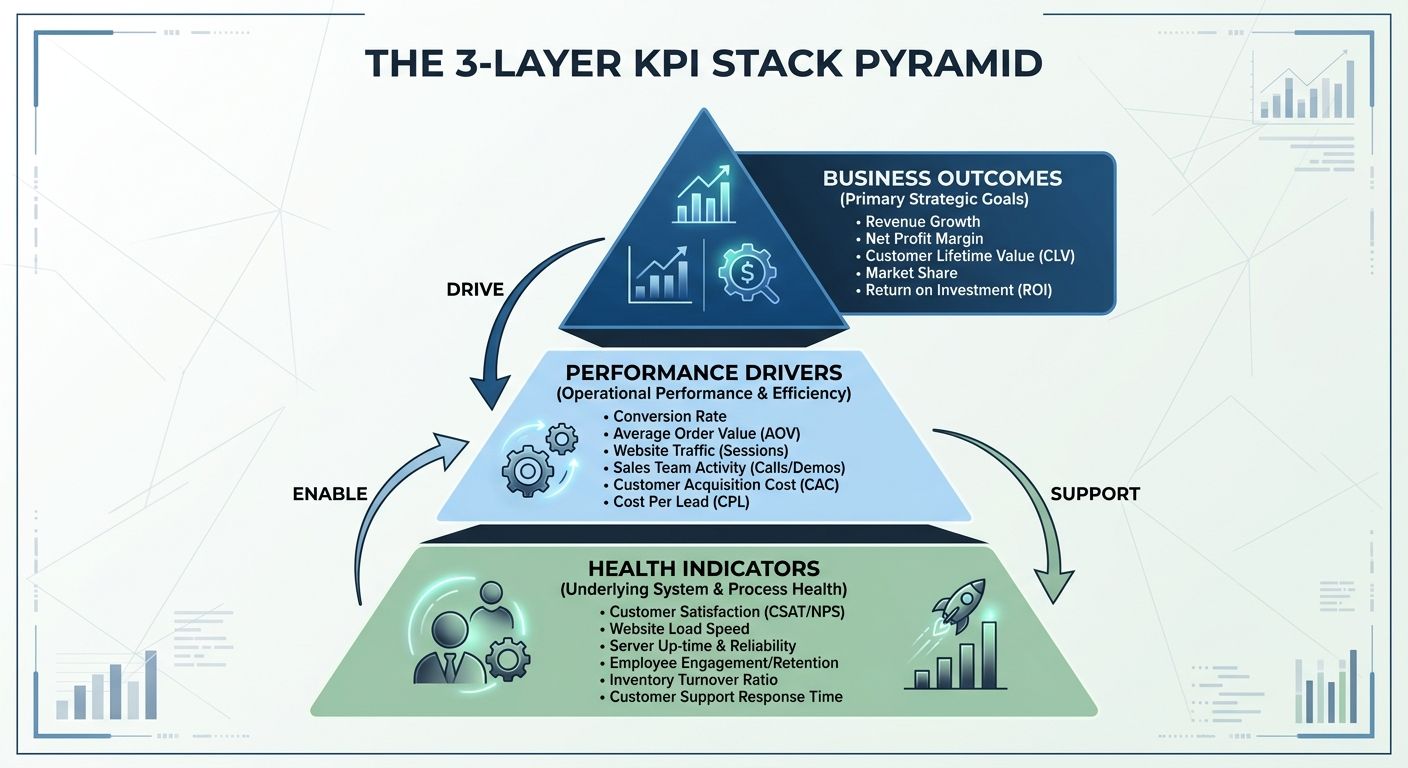
Here's the framework I recommend for organizing your KPI hierarchy. I call it the 3-Layer KPI Stack, and it forces alignment between what you promised and what you report:
Layer 1: Business Outcomes (top of the dashboard) These are the metrics the client's CFO or VP of Marketing cares about. Organic revenue, qualified leads from organic search, cost per organic acquisition, and customer lifetime value sourced from organic channels. These numbers answer the question: "Is this investment paying off?"
Layer 2: Performance Drivers (middle of the dashboard) These are the SEO-specific metrics that explain why Layer 1 is moving in a particular direction. Organic sessions with conversion segmentation, keyword visibility across target clusters, click-through rate from SERPs, and new referring domains. These numbers answer: "What's causing the business results?"
Layer 3: Health Indicators (bottom of the dashboard) Technical crawl health, Core Web Vitals scores, indexation coverage, and page speed. These numbers answer: "Is anything broken that could undermine Layers 1 and 2?"
The executive summary is the most critical section of any dashboard. Senior decision-makers often read only this section. Keep it under 200 words. Include three things: a one-sentence data-driven status update (such as "Organic revenue increased 12% month-over-month"), the single most significant achievement from the reporting period, and one clear action item tied to a business goal.
The Dashboard Architecture That Actually Works
Once the KPI framework is defined, the technical build follows a predictable sequence. The first decision is platform selection, and the options have consolidated significantly.
Platform | Pricing Range | GA4 Integration | White-Label | Real-Time Data | Best For |
|---|---|---|---|---|---|
Looker Studio | Free (with caveats) | Native | Limited | Yes | Budget-conscious agencies |
AgencyAnalytics | $79-$399/mo | Native | Full | Yes | Mid-market agencies |
Whatagraph | $199-$599/mo | Native | Full | Yes | Multi-channel reporting |
DashThis | $49-$449/mo | Native | Full | Yes | Simplicity-focused teams |
Reportz | $50-$250/mo | Native | Full | Yes | SEO-specific dashboards |
Each platform pulls from the same underlying data sources: Google Search Console, GA4, keyword tracking tools, and site audit platforms. The differentiator is how they present that data and how much customization they allow. Whatagraph's 2026 dashboard guide shows that modern dashboards now include KPI widgets for conversions, total revenue, event counts, and purchase revenue, with revenue breakdowns by session source and medium.
The build process itself follows five stages:
Connect data sources. GA4, Search Console, your rank tracker, and your backlink monitoring tool feed into the platform. Avoid manual data entry anywhere in the pipeline, because manual steps introduce errors and delays.
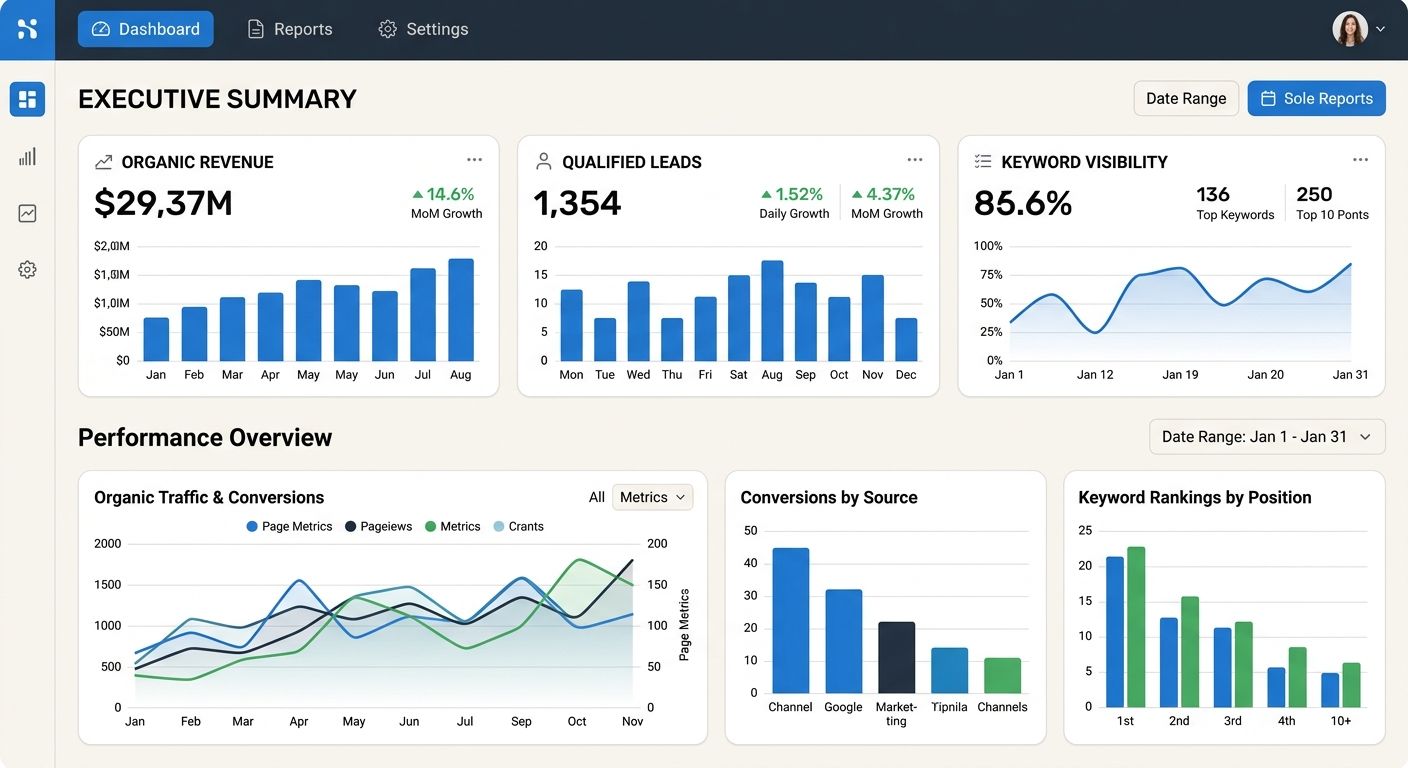
Configure the executive summary view. This is the landing page when a client opens the dashboard. Three to five KPI widgets showing Layer 1 metrics, a trend line comparing current versus previous period, and a text block where you write your monthly narrative.
Build the performance driver section. Keyword rankings organized by topic cluster (not alphabetical lists), organic traffic with conversion attribution, and SERP feature tracking. Flag keywords that trigger AI Overviews, featured snippets, or local packs. A position-one ranking below an AI Overview delivers significantly less traffic than it did 18 months ago, and clients need to understand that context.
Add the technical health module. A trending health score, a list of issues resolved during the period with their estimated impact, and a short priority queue showing upcoming fixes. This section builds trust because it demonstrates ongoing work, not a one-time audit.
White-label and deliver. Add the agency's branding (or the client's, depending on preference) and set delivery cadence. Monthly is standard for formal reviews, but the dashboard itself should be accessible in real time.
If you're evaluating whether your current tools justify their cost, the platform selection above covers the major price tiers. Most mid-market agencies land in the $150 to $300 per month range for reporting tools, which pays for itself if it prevents even one client from churning.
Tracking AI Referral Traffic as a Standalone Channel
Google's May 2026 core update, which began rolling out on May 21, accelerated a shift that was already underway: organic traffic is fragmenting across traditional search results, AI Overviews, and AI-powered answer engines like ChatGPT, Perplexity, and Gemini. Gartner predicts that 25% of organic traffic will shift to AI chatbots by the end of 2026. Dashboards that don't track these sessions separately are giving clients an incomplete picture.
AI Overviews appeared in up to 24.6% of search results during 2025. That number has grown in 2026, and the May core update rewards content with original insights and clear experience signals. Your dashboard needs a dedicated section that tracks three things:
First, AI referral sessions. GA4 can segment traffic from known AI platforms when UTM parameters and referral paths are configured correctly. Track sessions, engagement rates, and conversions from ChatGPT, Perplexity, Google AI Overviews, and other AI surfaces as their own channel.
Second, AI visibility by keyword cluster. For each target keyword group, note whether the client's content appears in AI-generated answers. This is a new client retention metric because clients are starting to ask about it. If you can't answer, they'll find an agency that can.
Third, citation tracking. When an AI system cites the client's content, that's a measurable brand visibility event. Track the frequency and context of those citations alongside traditional ranking data.
AgencyAnalytics's client retention research reinforces this point: "Marketing agencies that provide clear, consistent insights build trust, increase client satisfaction, and drive long-term loyalty." The agencies adding AI referral tracking to their dashboards now are the ones that will retain clients through the transition period.
As noted in Data Bloo's reporting guide, "Client SEO reporting should focus on demonstrating the value of SEO efforts and their impact on the client's business goals," with emphasis on KPIs that align with the client's objectives. In 2026, that means organic traffic, keyword rankings, conversions from organic search, and now AI-sourced visibility.
The Honesty Section Most Agencies Skip
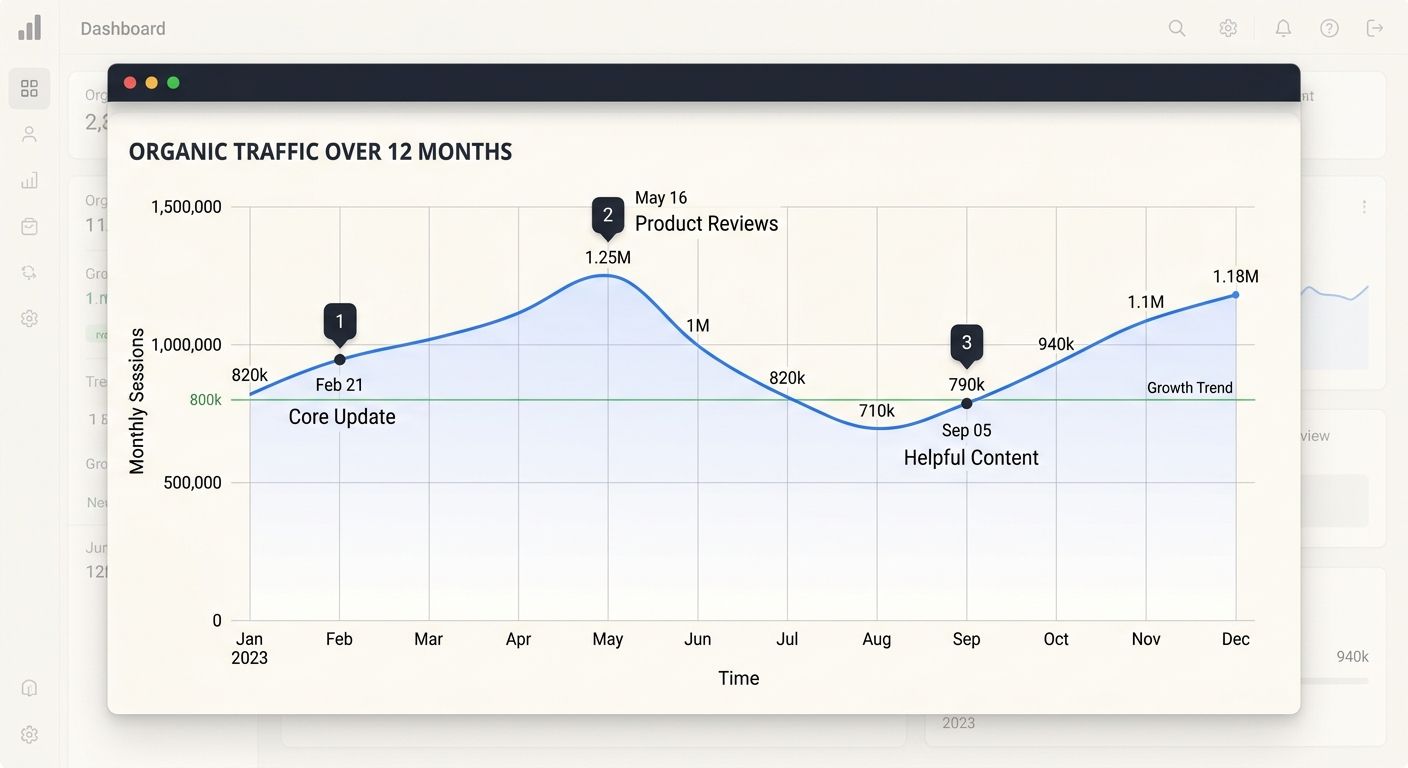
Algorithm volatility is the elephant in every SEO dashboard. Between 2024 and the current May 2026 core update, Google confirmed 12 algorithm updates. Rankings dropped for every agency's clients at some point during that stretch. The question is whether your dashboard addresses those drops honestly or pretends they didn't happen.
Transparent dashboards include an "algorithm impact" annotation layer. When a confirmed update rolls out, the dashboard flags the date on every trend line. When a client's rankings drop after an update, the narrative explains what happened, why it happened, and what the recovery plan looks like. Typical recovery timelines run 2 to 3 months, and stating that explicitly sets appropriate expectations.
The reporting guidance from Elorus's business transparency research puts it plainly: agencies should "regularly share your results and what they mean" and "create clear and concise reports that aren't full of industry jargon or complex terminology." Writing at an 8th or 9th-grade reading level isn't dumbing things down. It's respecting your client's time. They hired you for SEO expertise so they don't have to become SEO experts themselves.
I've seen agencies lose six-figure contracts because they buried a traffic drop in page 11 of a PDF and the client discovered it independently. The client didn't leave because traffic dropped. They left because the agency hid it.
The State of Play
The SEO client reporting landscape has shifted from static documents to living dashboards that clients access in real time. The agencies winning on retention have three things in common: their dashboards align metrics to contracted objectives using a defined SEO KPI framework, they track AI referral traffic as a distinct channel, and they address bad news before the client has to ask about it.
Real-time access changes the dynamic between agencies and clients. When clients can check their own dashboard at any time, anxiety drops and ad-hoc "how are things going?" emails decrease. The relationship shifts from interrogation to collaboration. According to Fugo's dashboard guide, including the right KPIs with clear reporting context transforms the dashboard from a data dump into a strategic planning tool.
The 3-Layer KPI Stack (business outcomes, performance drivers, health indicators) gives you a repeatable structure. The AI referral tracking layer gives you forward-looking relevance. And the honesty layer, the algorithm annotations and plain-language explanations, gives you something most agencies still haven't figured out how to deliver: trust that survives a bad quarter.
If you've been relying on the same reporting template since 2023, the gap between what your dashboard shows and what your clients actually need to see has grown wider with every Google update. Closing that gap is the highest-ROI retention investment an agency can make this year.
Marcus Webb
Digital marketing consultant and agency review specialist. With 12 years in the SEO industry, Marcus has worked with agencies of all sizes and brings an insider perspective to agency evaluations and selection strategies.
Related Articles

The Enterprise SEO Benchmarking Blindspot: Why Your 2026 Performance Dashboard Is Missing Critical Metrics
Fifty-eight percent of U.S. Google searches now end without a click to any external site, per SparkToro tracking data.
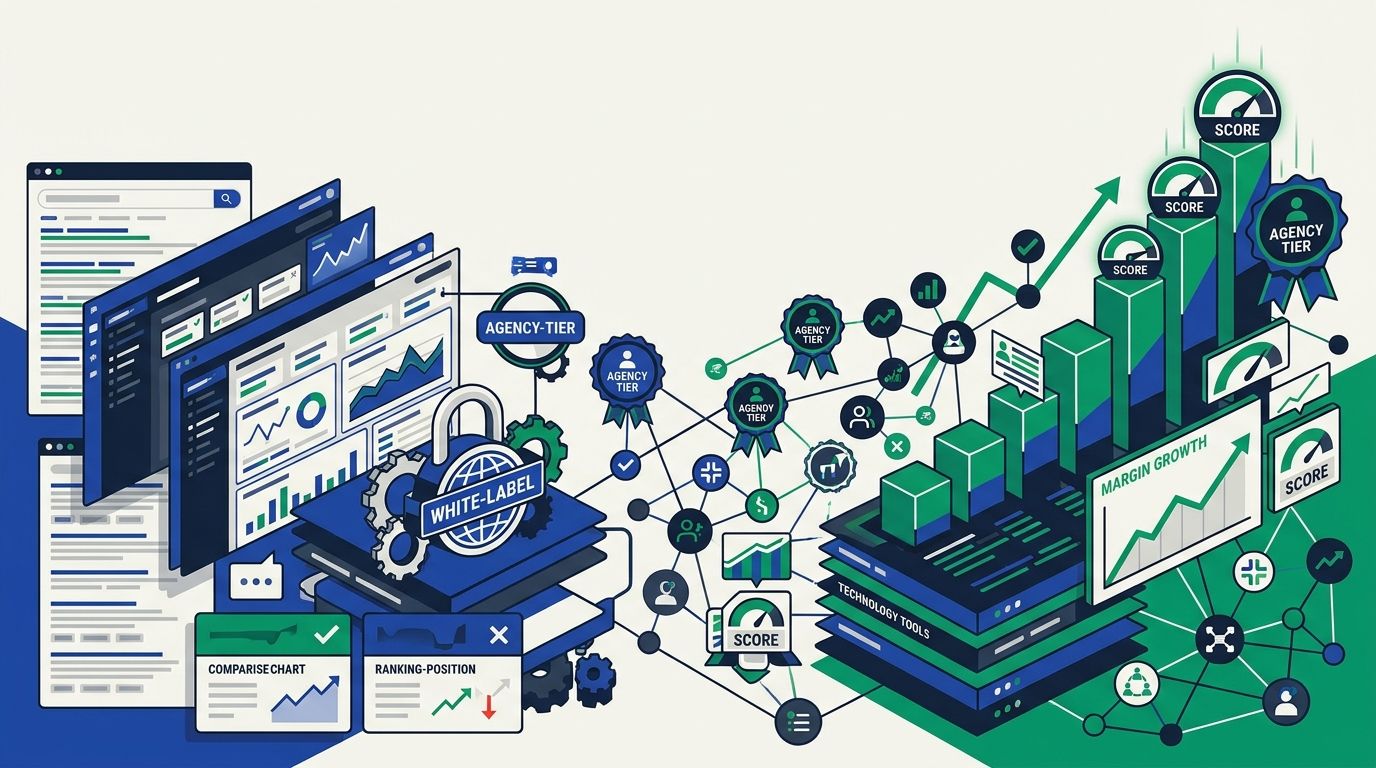
White-Label SEO Tools vs. Full-Service Agency Ownership: Building Your Tech Stack for Margin and Client Retention in 2026
Agency tech stack ROI hinges on one architectural choice: whether you rent white-label SEO tools or own your reporting infrastructure outright.
The SEO Benchmarking Audit: Building Your 2026 Performance Dashboard Against Industry Standards
Three agencies pitched the same mid-market SaaS company in January 2026, and each one submitted a "performance dashboard" as proof of their methodology. I reviewed all three as part of an agency selection engagement. Dashboard A tracked 47 metrics with no benchmarks.
Explore more topics