Building Developer-Friendly SEO Into Your CI/CD Pipeline: A Technical Checklist for Modern Teams
CI/CD SEO validation embeds automated search-visibility checks directly into deployment pipelines, catching regressions before they reach production.
 Marcus Webb··9 min read
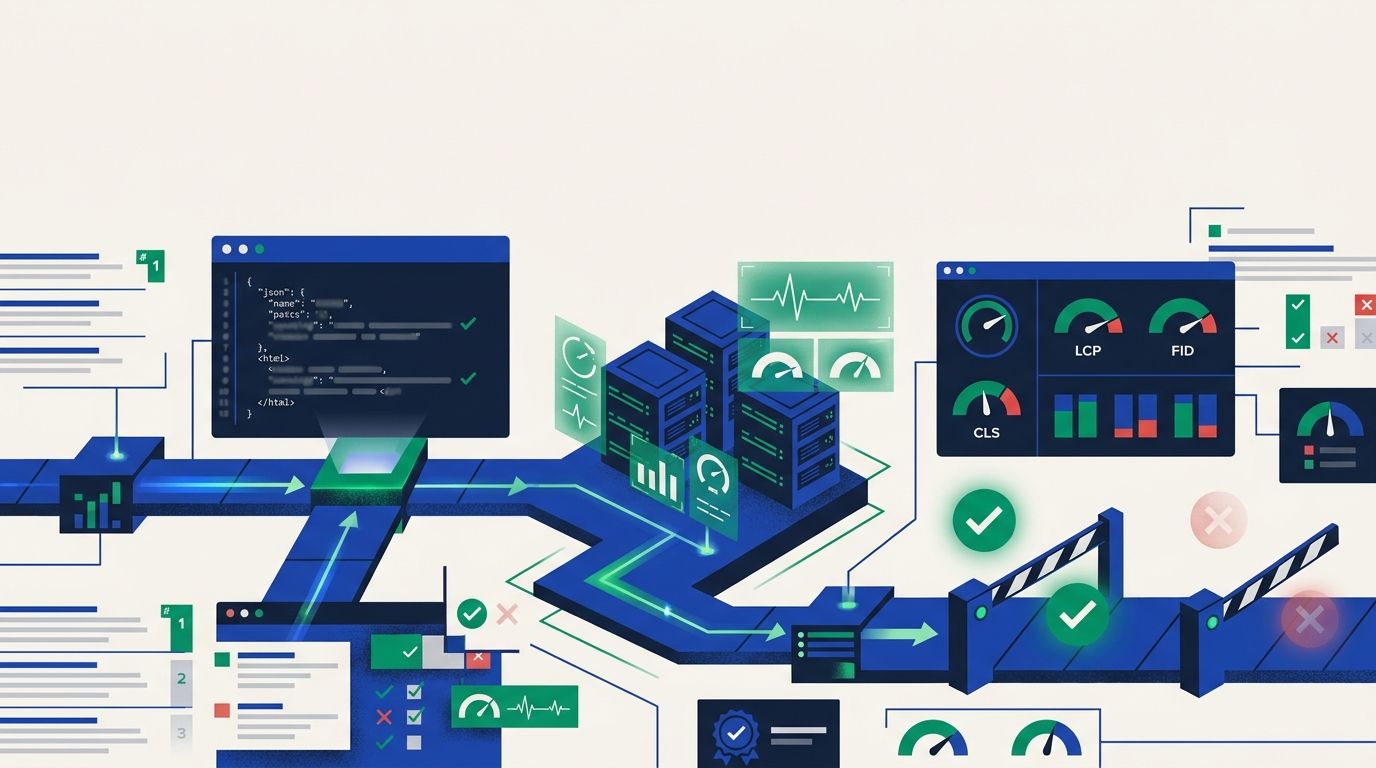
Building Developer-Friendly SEO Into Your CI/CD Pipeline: A Technical Checklist for Modern Teams
CI/CD SEO validation embeds automated search-visibility checks directly into deployment pipelines, catching regressions before they reach production. The mechanism corrects a persistent workflow gap: development teams ship code that passes every functional test while silently breaking canonical tags, structured data, or Core Web Vitals thresholds — problems that surface weeks later as ranking drops no one can explain.
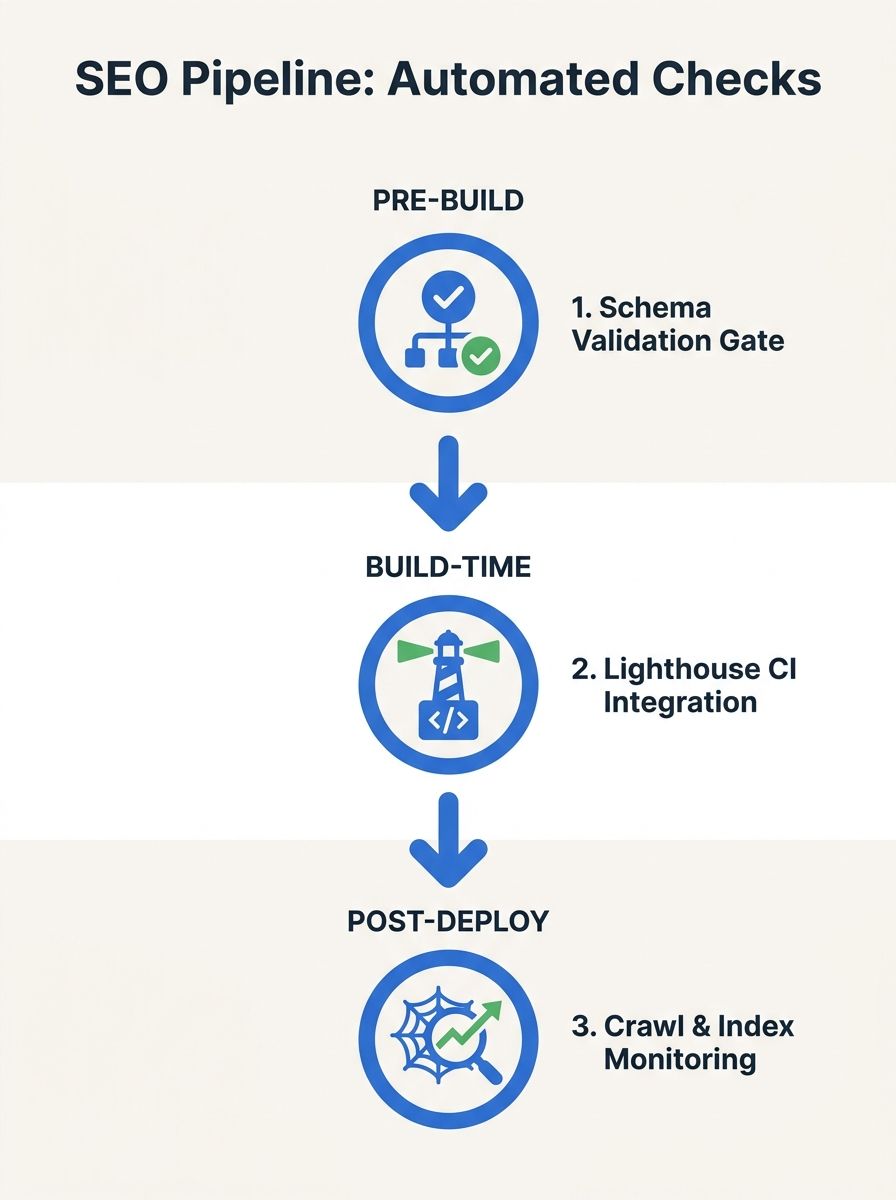
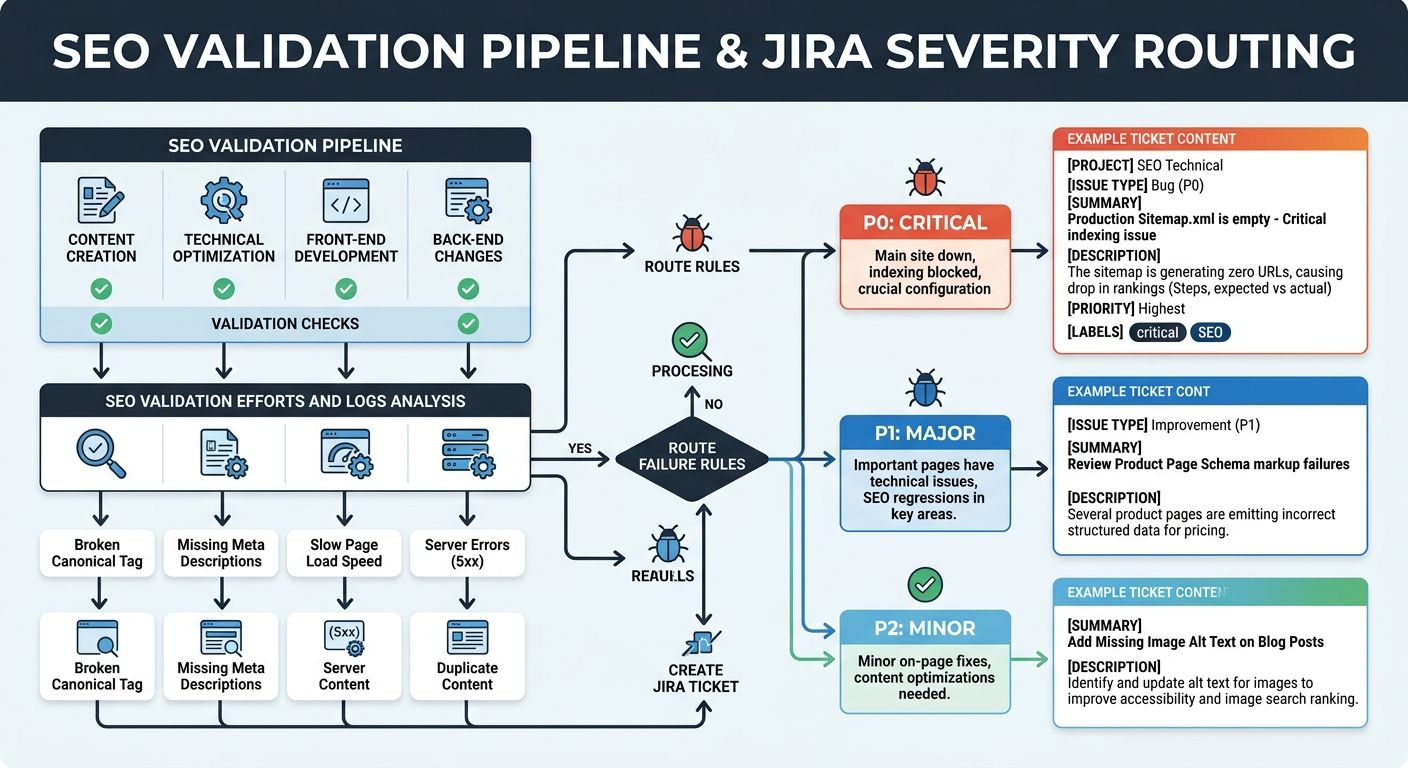
The Three-Gate SEO Pipeline
The mechanism operates as three distinct validation layers, each triggered at a different stage of the deployment process. Think of it like airport security: pre-build screening catches obvious violations before code compiles, build-time gates enforce performance thresholds during the build itself, and post-deploy monitoring watches for problems that only appear once real traffic hits.
As described in Brigita's technical documentation, "Continuous SEO Delivery means automating technical SEO validations throughout the development lifecycle. Instead of waiting for issues to appear in search results, SEO quality is tested before, during, and after deployment." For white-label agencies managing 10, 20, or 50 client sites, this shift from reactive auditing to pre-deployment validation is what separates scalable operations from constant firefighting.
The pipeline doesn't replace your SEO team. It replaces the manual checklist your SEO team forgets to run at 4:47 PM on a Friday deploy. If you've been debugging ranking drops after they happen, this approach moves the detection point upstream by days or weeks.
Pre-Build: Static Analysis and Structured Data Validation
The first gate runs before compilation. It parses templates and configuration files for SEO violations that don't need a browser to detect: missing title tags, duplicate meta descriptions across routes, orphaned canonical URLs pointing to non-existent pages, and malformed JSON-LD.
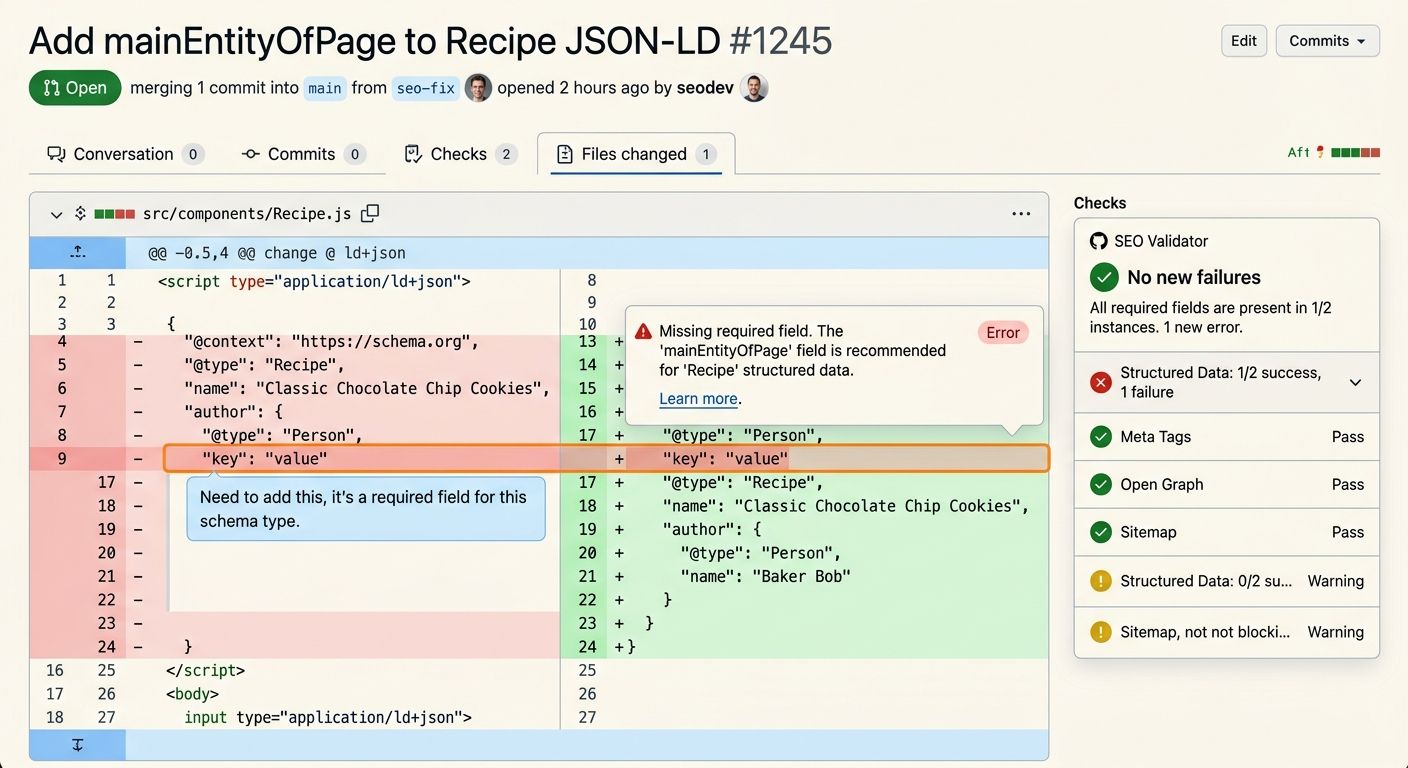
Structured data testing in deployment is where most teams start because the failure mode is binary — your schema is either valid JSON-LD with required properties or it isn't. The Schema.org Markup Validator handles the validation logic, checking embedded structured data against the Schema.org specification. For CI integration, a GitHub Action called Schemar wraps this validator and "fails if structured data is missing or invalid," surfacing results directly in pull request checks.
The pre-build layer also handles what I'd call structural SEO hygiene. These are the checks:
Title tag presence and length: Flag pages with titles under 30 or over 60 characters
Meta description uniqueness: Catch duplicate descriptions across route templates
Canonical tag validation: Confirm canonical URLs resolve to 200-status pages
Hreflang consistency: Verify reciprocal hreflang tags match across language variants
Robots meta directives: Alert when noindex tags appear on pages that should be indexed
JSON-LD syntax validation catches broken code, missing brackets, and quote errors, while structural validation checks for required Schema.org keys. That second layer is where developers trip up most often. Your JSON might parse cleanly but still be missing the "name" or "datePublished" fields that Google requires for rich results.
For white-label operations, the pre-build gate is your quality floor. Every client site gets the same validation rigor regardless of which developer touches the code. The flowforfrank/seo-checklist framework provides a systematic starting point that turns these checks into repeatable, enforceable rules rather than suggestions in a wiki nobody reads.
Build-Time: Lighthouse CI and Performance Budget Gates
The second gate fires during the build process itself, running a headless browser against rendered pages to measure real performance metrics. This is where Core Web Vitals automation lives.
Google evaluates real-user metrics via the Chrome User Experience Report (CrUX) at the 75th percentile, meaning your site's performance is judged by what 75% of actual visitors experience. The thresholds that matter for rankings are hard numbers: LCP ≤ 2.5 seconds, INP ≤ 200 milliseconds, and CLS ≤ 0.1. INP replaced First Input Delay as a Core Web Vital in March 2024, and it penalizes JavaScript-heavy pages that feel sluggish during interaction.
Lighthouse CI, the CI/CD variant of Google's Lighthouse auditing tool, can be incorporated into pipelines for continuous page auditing. You configure performance budgets as build-fail thresholds:
Metric | Pass Threshold | What It Measures | Common Failure Cause |
|---|---|---|---|
LCP | ≤ 2.5s | Largest visible content load time | Unoptimized hero images, slow TTFB |
INP | ≤ 200ms | Responsiveness to user interaction | Long-running JS tasks (>50ms) |
CLS | ≤ 0.1 | Visual stability during load | Images without dimensions, injected ads |
JS Bundle Size | < 150KB gzipped | Total JavaScript payload | Unshaken dependencies, polyfill bloat |
CSS Footprint | < 50KB gzipped | Total stylesheet size | Unused CSS from component libraries |
TTFB | < 600ms | Server response time | Missing CDN, slow database queries |
When any metric exceeds its threshold, the build fails. The developer sees a red check in their pull request, the deployment halts, and the specific regression gets flagged with before/after comparisons.
As DevOps.com documented, integrating automation and performance testing is essential for making Core Web Vitals SEO a natural part of the DevOps workflow, using observability tools to optimize data-drivenly rather than reactively. This is the developer SEO automation layer that engineering teams actually adopt because it speaks their language: budgets, thresholds, pass/fail.
Post-Deploy: Crawl Monitoring and Regression Alerts
The third gate activates after deployment, monitoring the live site for problems that only emerge under real conditions. Pre-build and build-time checks run against local or staging environments. Post-deploy monitoring validates that production behaves the same way.
Specialized tools like ContentKing, Screaming Frog's API, and Sitebulb can be integrated into CI/CD pipelines for specialized SEO testing without building everything from scratch. Your choice depends on your team's existing infrastructure and the number of client sites you're managing.
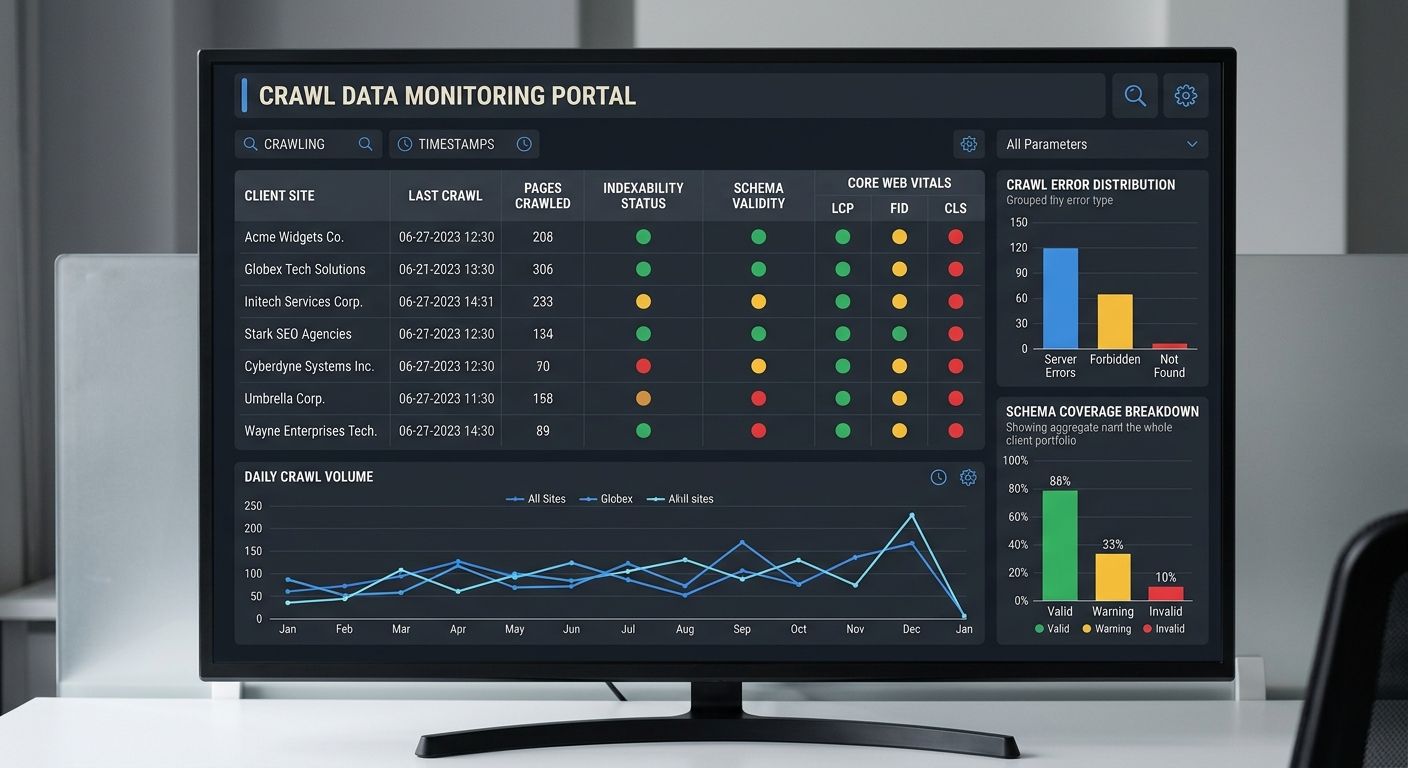
Post-deploy monitoring covers three areas that pre-build checks can't reach:
Indexability verification. Confirm that your robots.txt isn't accidentally blocking critical paths, that XML sitemaps return 200 status codes, and that new pages are discoverable within 2 crawl cycles. This also extends to AI crawler governance — configuring access rules for bots like OAI-SearchBot, GPTBot, and Google-Extended.
Rendering validation. Pure client-side rendered pages can pass static analysis while failing in production because search bots see empty HTML shells. Post-deploy checks render pages with a headless browser and compare the DOM output against expected elements. If your hero content requires JavaScript execution and the bot gets a blank div, this is where you catch it.
Continuous Core Web Vitals tracking. Tools like DebugBear or SpeedCurve provide continuous monitoring that alerts when vitals degrade before users complain. Synthetic monitoring runs continuously, 24/7, in a controlled setup to measure LCP, INP, and CLS consistently over time, providing the early warning system that CrUX's 28-day window can't deliver.
Routing Failures Into Developer Workflows
Detection without action produces dashboards nobody checks. The mechanism works only when validated SEO issues flow into the same project management systems developers already use.
As MygomSEO's technical documentation puts it: "Pipe validated issues into Jira, GitHub Issues, or Asana. Include severity, affected templates, and a suggested fix. Attach evidence, like crawl samples and example URLs. Add a release checklist item for each class of failure."
This routing layer is where the technical SEO checklist for developers becomes operationally real. A severity classification system prevents alert fatigue:
P0 (build-blocking): Noindex on production pages, missing canonical tags, LCP > 4s, broken JSON-LD syntax. These fail the build automatically.
P1 (deploy-warning): LCP between 2.5s and 4s, CLS between 0.1 and 0.25, missing Open Graph tags. These log warnings and create tickets but don't block deploys.
P2 (improvement): Image alt text gaps, suboptimal title tag length, minor CLS shifts under 0.1. These queue for sprint planning.
For white-label agencies, this severity system becomes part of your service agreement. You're not telling clients "we'll monitor SEO" — you're showing them a pipeline where P0 issues physically cannot ship to production. That's a tangible differentiator when you're evaluating your agency tech stack and deciding what tooling to standardize across accounts.
And the ticket routing matters operationally. When a developer gets a Jira ticket that says "CLS regression on /pricing — CLS increased from 0.04 to 0.18 after PR #4521 added a dynamically loaded testimonial block," they can fix it in 20 minutes. Compare that to getting an email three weeks later saying "rankings dropped on the pricing page" with zero diagnostic context.
Scaling the Pipeline Across Client Sites
White-label teams face a unique challenge: every client site has different CMS configurations, different template structures, and different performance profiles. A pipeline that works perfectly for a Next.js marketing site will need adjustment for a WordPress multisite or a Shopify storefront.
The practical approach is maintaining a shared validation core (the P0 checks that apply universally) while allowing per-client configuration overrides for thresholds and rules. Your LCP budget might be 2.5s for a lightweight SaaS site but 3.0s for an image-heavy e-commerce client where sub-2.5s isn't achievable without a full redesign.
This is also where your hidden technical problems tend to live. Template-level SEO bugs — a missing canonical tag in a shared layout component, a schema injection that works on blog posts but breaks on product pages — multiply across every page that uses that template. Catching them in the pipeline before deployment prevents what I've seen happen repeatedly at agencies: one template change silently deindexing 400 product pages across a client's site.
Where The Pipeline Breaks Down
The three-gate model has real limitations, and pretending otherwise would be dishonest.
Dynamic content defeats static analysis. If your structured data gets injected by JavaScript after page load, pre-build template scanning won't catch schema errors. You need the post-deploy rendering check as a backstop, which means there's a window between deployment and detection where broken schema is live on production.
Synthetic monitoring diverges from field data. Lighthouse CI runs on a controlled machine with consistent CPU, memory, and network conditions. Real users browse on 4-year-old Android phones over congested mobile networks. A page that scores 95 in Lighthouse CI can still fail CrUX's 75th percentile threshold. Synthetic tests set a floor, not a ceiling.
Alert fatigue kills adoption. I've watched agencies build elaborate pipelines with 30+ validation rules, only to see developers start ignoring the alerts within two months because 80% of failures were P2 cosmetic issues clogging the same notification channel as P0 build-blockers. Severity classification and thoughtful threshold-setting determine whether your pipeline gets used or becomes another ignored dashboard.
Content-level SEO remains manual. The pipeline validates technical infrastructure: are the tags present, is the schema valid, do the vitals pass. It cannot evaluate whether your page actually answers the query it's targeting, whether your content satisfies search intent, or whether your internal linking supports topical authority. Those decisions still require human judgment and a different kind of SEO checklist than the one your CI pipeline runs.
Cross-page relationships are invisible. A single-page validation pipeline can't detect site-wide crawl budget waste from duplicate content clusters, cannibalization between pages targeting the same keyword, or broken internal link graphs. These problems require crawl-level analysis tools running on separate schedules, not per-deploy checks.
The pipeline works well as a prevention system for known, automatable failure modes. Expecting it to replace your SEO strategy is where teams get into trouble. The mechanism catches regressions with precision. It has nothing to say about whether you're building the right pages in the first place.
Marcus Webb
Digital marketing consultant and agency review specialist. With 12 years in the SEO industry, Marcus has worked with agencies of all sizes and brings an insider perspective to agency evaluations and selection strategies.
Related Articles
Building SEO into Your Development Workflow: The Technical Checklist Developers Actually Use
The technical SEO implementation checklist pinned to your dev team's project board tells you more about who to hire than any portfolio review or coding interview ever will. Agencies that integrate SEO-first development practices into their build process ship sites that perform from day one.

The SEO Debugging Workflow: A Framework for Diagnosing Visibility Drops in Under 48 Hours
A five-layer diagnostic sequence (crawl, render, index, rank, click) applied in strict dependency order isolates the root cause of organic visibility drops faster than any other method I've tested across 200+ agency evaluations.

The Invisible SEO Audit: Fixing Hidden Technical Problems Before Rankings Improve
Fifty-six percent of companies now run AI-driven SEO monitoring to catch invisible technical problems in real time, according to 2026 marketing data.
Explore more topics