SEO Benchmarking Without the Guesswork: Building Your Custom Performance Dashboard in 2026
A client fired their agency over a 40% drop in "organic visibility" that never actually happened.
 Marcus Webb··9 min read
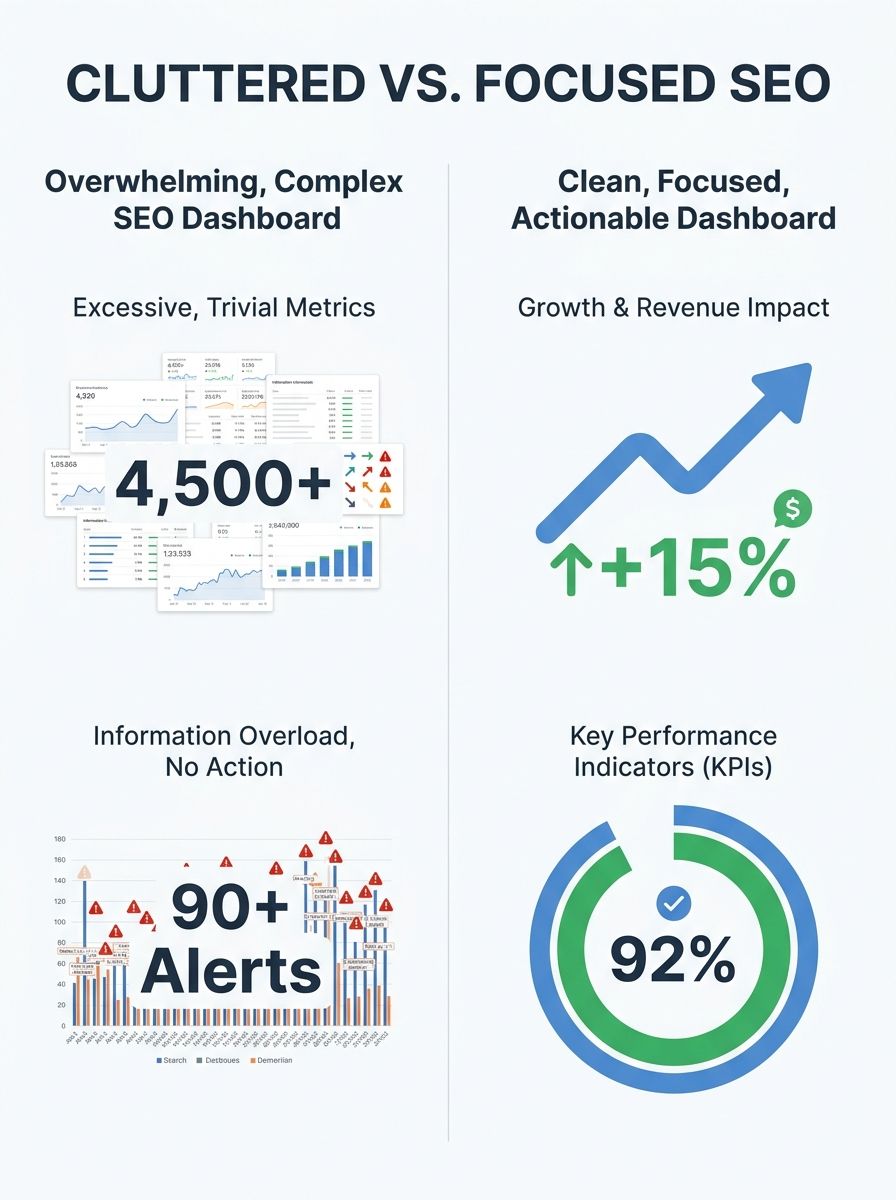
SEO Benchmarking Without the Guesswork: Building Your Custom Performance Dashboard in 2026
A client fired their agency over a 40% drop in "organic visibility" that never actually happened. The agency had been reporting a blended metric from Semrush that mixed branded and non-branded traffic, compared it against an irrelevant competitor set, and presented it on a dashboard so cluttered it looked like a stock trading terminal. When I audited the situation, organic revenue was actually up 12% year-over-year. Real conversions, real money. But because nobody had built a dashboard tied to metrics that mattered, a perfectly good agency relationship ended in a shouting match on a Thursday afternoon Zoom call.
I've seen this exact scenario play out dozens of times across the 200+ agencies I've evaluated. The problem isn't a lack of data. It's a lack of clarity about what to measure, how to contextualize it, and how to automate the reporting so you're not burning 6 hours a month copying numbers into spreadsheets.
This is your practical guide to SEO performance benchmarking that actually drives decisions, not just decorates slide decks.
Why Most SEO Dashboards Are Expensive Wallpaper
Here's the blunt truth: most SEO dashboards I audit are vanity metric museums. They track everything and communicate nothing.
The typical setup pulls keyword rankings, total backlinks, Domain Authority (or DR, or AS, depending on which tool religion you follow), and a traffic line graph. It looks impressive. It tells leadership almost nothing actionable.
According to Rankability's analysis of critical SEO benchmarks, metrics like Domain Authority, Domain Rating, and Authority Score are estimates and are NOT a Google ranking factor. Yet I routinely see agencies build entire reporting narratives around these numbers. They're useful directional signals. They're terrible KPIs.
The shift I'm seeing across smart teams is straightforward: stop measuring activity, start measuring outcomes. That means your dashboard needs to answer three questions every time someone opens it:
Is organic search driving more revenue this month than it did before?
Are we gaining or losing ground against specific competitors?
Where are the biggest opportunities we're not capturing?
If your current reporting can't answer those in under 30 seconds, you need a rebuild.
The SEO KPIs That Actually Matter Right Now
The organic traffic metrics 2026 demands look fundamentally different from what we tracked even two years ago. About 60% of searches now end without a click, driven by AI Overviews, featured snippets, and knowledge panels resolving intent directly on the results page. If your primary KPI is still raw organic sessions, you're measuring an increasingly incomplete picture.
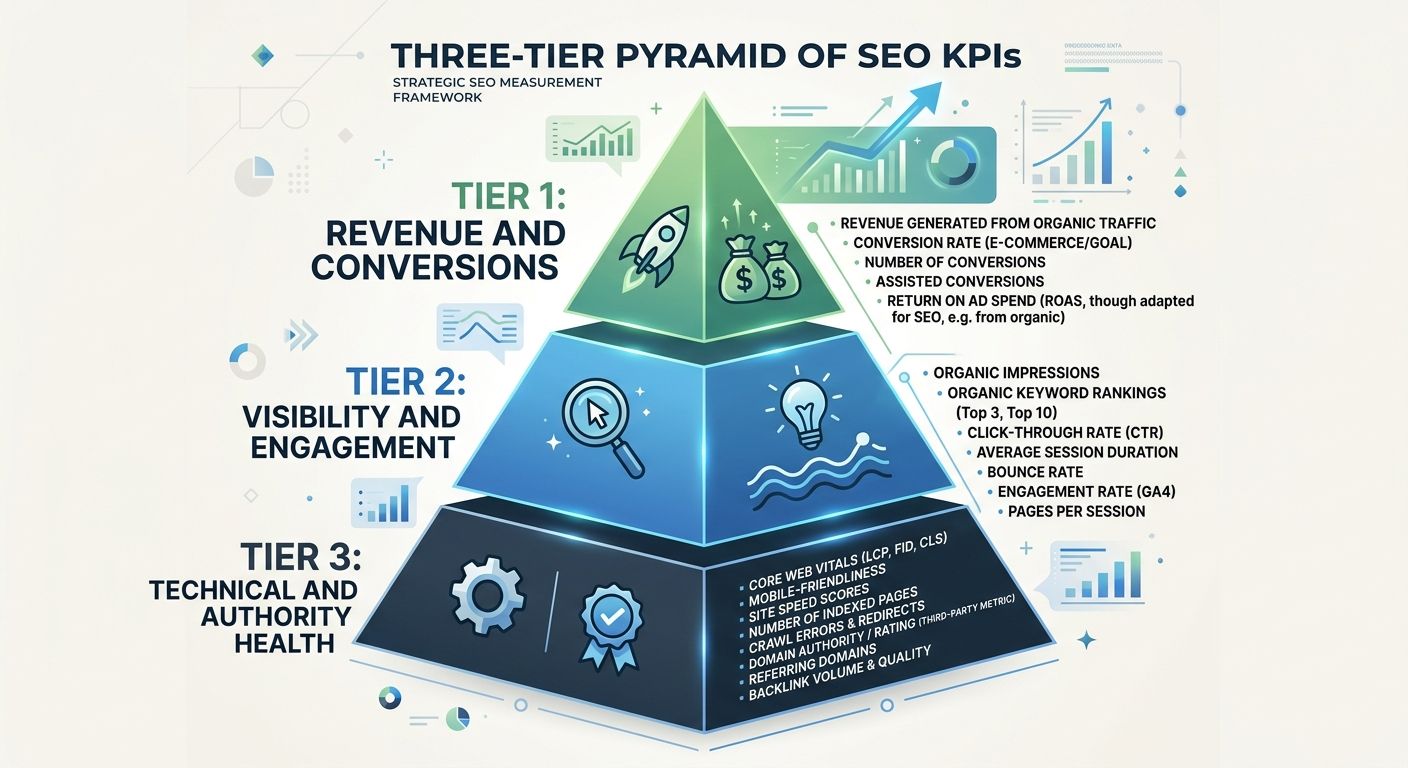
Here's my recommended SEO KPI tracking setup, split into three tiers:
Tier 1: Revenue and Conversion Metrics
These are the numbers your CFO cares about. They go at the top of every dashboard I build.
Organic revenue (tracked via GA4 ecommerce or CRM attribution)
Organic-assisted conversions (multi-touch, not just last-click)
Cost per organic acquisition compared to paid channels
Pipeline contribution from organic (for B2B companies)
According to WebFX's proprietary benchmark data, practitioners consistently rank conversions and revenue as the most valuable metrics, with raw rankings considered increasingly misleading. I agree completely. Rankings without revenue context are just numbers on a screen.
Tier 2: Visibility and Engagement Metrics
These tell you whether your organic presence is growing or shrinking, and whether the traffic you do attract is worth anything.
SERP real estate ownership across features (organic listings, featured snippets, local packs, video carousels)
Click-through rate by query type (branded vs. non-branded)
Engagement rate and session depth from organic visitors
AI platform visibility (brand mentions in Google AI Overviews, ChatGPT, Perplexity)
That last one is new for most teams. Search Engine Land introduced LLM Consistency and Recommendation Share (LCRS) as a KPI, which focuses on building a repeatable, comparative presence across AI platforms. It's not about chasing individual citations. It's about measuring whether AI systems consistently recommend your brand when users ask relevant questions.
Tier 3: Technical and Authority Health
These are your early warning systems. They don't go on the executive dashboard, but they absolutely go on the SEO team's working dashboard.
Core Web Vitals (LCP under 2.5s, INP under 200ms, CLS under 0.1)
Crawl budget efficiency (pages crawled vs. pages indexed vs. pages driving traffic)
Backlink velocity and quality (new referring domains per month from relevant sites)
Content freshness distribution (percentage of ranking pages updated within 12 months)
If you're dealing with technical issues that are silently killing your rankings, I wrote about a systematic approach to diagnosing visibility drops that pairs well with this tier of metrics.
Building Your Competitive Benchmarking Framework
SEO performance benchmarking without competitive context is like checking your race time without knowing where the other runners finished. You need a framework that tells you not just how you're doing, but how you're doing relative to the sites actually competing for your customers.
Here's the four-step framework I use with every client:
Step 1: Define Your Real Competitor Set
This is where most teams go wrong immediately. Your business competitors and your SEO competitors are often different entities entirely. A regional law firm doesn't compete with LegalZoom in the boardroom, but they absolutely compete in the SERPs for "personal injury lawyer near me."
I recommend building two competitor lists:
Direct competitors (3-5 companies): Same products, same markets, similar size. These are your true benchmarks.
Aspirational competitors (2-3 companies): Larger players dominating the SERPs you want to own. These show you what "great" looks like, but don't panic when you trail them.
Avoid the trap of benchmarking against industry giants when you're a mid-market company. A $5M revenue company shouldn't beat itself up over losing to a $500M competitor with a 50-person content team.
Step 2: Identify Overlap and Gap Keywords
Pull keyword universes for each competitor and map the overlaps. You're looking for three categories:
Shared keywords where you're winning: Protect these.
Shared keywords where you're losing: Prioritize these for content updates or new pages.
Competitor-only keywords: Evaluate whether these represent real opportunities or irrelevant traffic.
Tools like Semrush, Ahrefs, or Sistrix can automate this comparison. But here's my strong recommendation: segment by search intent. Informational queries range from 35% to 60% of total search volume depending on industry. Comparing your transactional page against a competitor's informational guide is apples to oranges.
Step 3: Track Competitive Metrics Monthly
Your competitive benchmarking framework should track these signals on a monthly cadence:
Share of voice for your target keyword clusters
Competitor content publishing velocity
New referring domains competitors are acquiring
SERP feature ownership shifts
AI Overview inclusion rates for your shared keywords
Step 4: Set Realistic Improvement Targets
Based on Promodo's benchmark research, you can set industry-specific targets. But be honest about your starting position. If you're at position 15 for a competitive term, getting to position 8 in 90 days is aggressive but possible. Getting to position 1 is a fantasy unless your competitors are sleeping.
The Technical Setup: Building Your Dashboard
Enough theory. Here's how to actually build the thing.
Choosing Your Platform
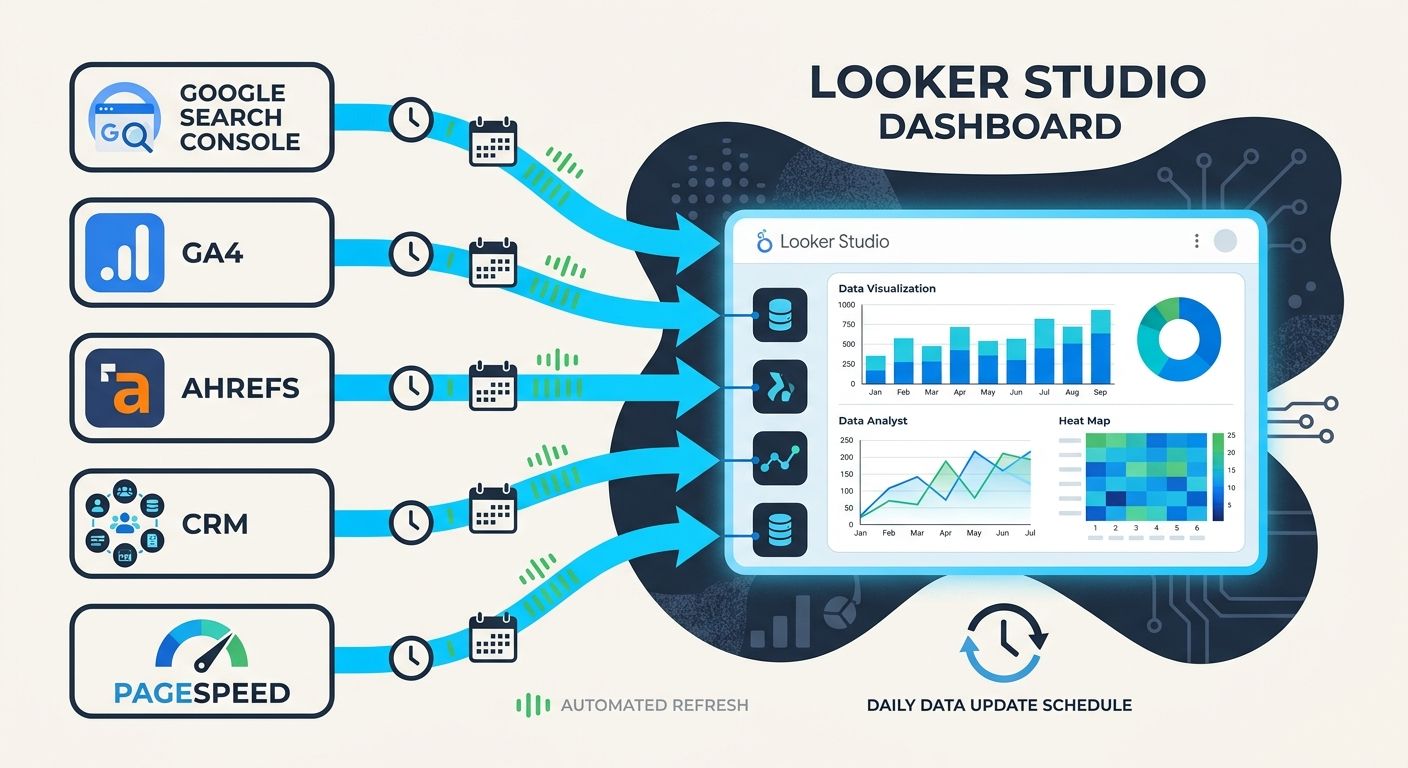
I've built SEO dashboards in Looker Studio, Power BI, Tableau, Databox, and custom-built solutions. For 80% of teams, Looker Studio (formerly Google Data Studio) is the right choice. It's free, connects natively to Google Search Console and GA4, and supports third-party connectors for tools like Ahrefs and Semrush.
According to Data Bloo's Looker Studio guide, you can build a dashboard with real-time data from GA4, Search Console, and Ahrefs that's easy to customize and share. That matches my experience. The setup takes 4-8 hours for a solid first version, and you'll iterate from there.
For agencies managing multiple clients, platforms like SE Ranking offer built-in task management alongside customizable dashboards, which helps connect reporting to actual SEO workflow. This matters when you're trying to answer "we see the problem, now who's fixing it?"
If you're weighing whether to build custom dashboards or subscribe to all-in-one platforms, the considerations around API-first approaches versus subscription tool sprawl are worth understanding before you commit budget.
Data Sources You Need Connected
At minimum, connect these:
Google Search Console (impressions, clicks, CTR, average position by query and page)
GA4 (organic sessions, engagement rate, conversions, revenue)
Your rank tracking tool (Semrush, Ahrefs, AccuRanker, or similar)
Your backlink monitoring tool (often the same as rank tracking)
Google Business Profile (for local SEO metrics, if applicable)
For advanced setups, also pull in:
CRM data (Salesforce, HubSpot) to track organic-sourced pipeline
Site speed monitoring (PageSpeed Insights API, CrUX data)
AI visibility tracking (BrightEdge, Profound, or manual monitoring)
Dashboard Layout That Works
After building dozens of these, here's the layout I keep coming back to:
Page 1: Executive Summary
Organic revenue vs. target (big number, top center)
Organic sessions trend (13-month rolling chart)
Top 5 performing pages by revenue
Competitive share of voice snapshot
Page 2: Keyword and Visibility Detail
Rankings distribution (how many keywords in positions 1-3, 4-10, 11-20, 20+)
Movement summary (keywords gained vs. lost top 10)
SERP feature ownership
AI Overview presence for tracked terms
Page 3: Technical Health
Core Web Vitals pass/fail by page category
Crawl stats from Search Console
Index coverage issues
Backlink growth trend
Page 4: Competitive Intelligence
Share of voice by competitor
Content gap analysis
Competitor backlink acquisition rate
Emerging competitor alerts
If you've recently gone through an agency transition and need to migrate reporting infrastructure, this four-page structure gives you a clean starting point that any new team can inherit.
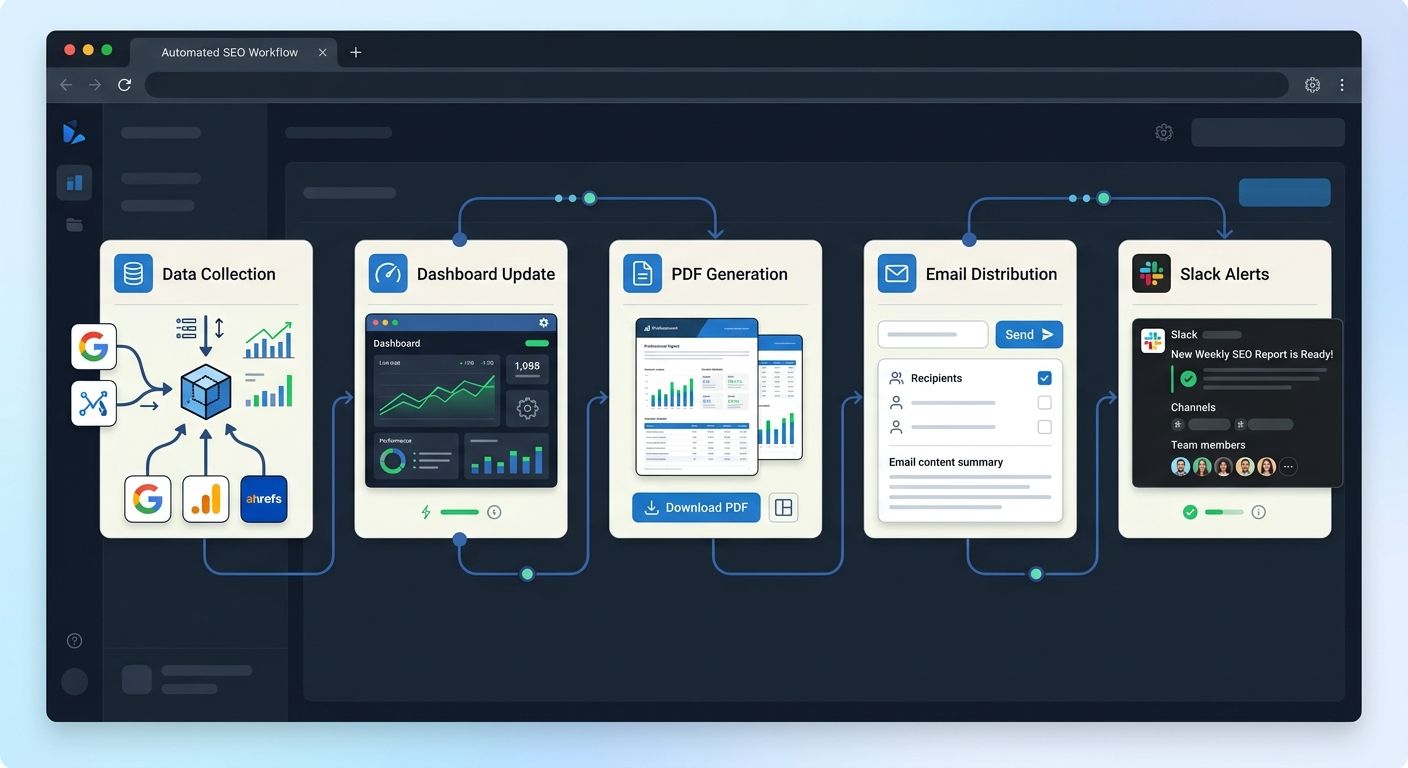
SEO Reporting Automation: Stop Wasting Hours
Building the dashboard is step one. Automating it so it updates and distributes itself is where the real time savings kick in.
Here's my automation stack recommendation:
Data refresh: Looker Studio pulls from Search Console and GA4 automatically. For third-party tools, use Supermetrics ($29-$99/month for most setups) or the free Search Analytics for Sheets add-on for basic Search Console data.
Scheduled distribution: Set up scheduled PDF reports sent weekly or monthly to keep stakeholders informed. Most dashboard tools support this natively, as noted by multiple reporting platform reviews.
Alert triggers: Configure alerts for significant changes. A 20%+ drop in organic sessions week-over-week, a Core Web Vitals failure on a high-traffic template, or a sudden loss of featured snippet ownership should all trigger notifications to Slack or email.
Annotation layer: Build in a way to mark algorithm updates, site changes, and content launches on your timeline charts. Without annotations, every traffic fluctuation becomes a mystery that eats up analysis time.
The effective SEO reporting dashboards, as Coupler.io's analysis highlights, integrate four critical perspectives: technical performance, content effectiveness, user behavior, and competitive positioning. Your automation should serve all four without requiring manual data entry for any of them.
For teams tracking how Google's algorithm shifts affect their benchmarks, pairing your dashboard with an understanding of what recent core updates mean for your SEO benchmarks keeps your analysis grounded in what's actually changing in search.
What This Costs (Real Numbers)
Because I always include pricing, here's what you should budget:
DIY with Looker Studio + free connectors: $0-$50/month. You're paying in time (8-12 hours setup, 2-4 hours monthly maintenance).
DIY with paid connectors (Supermetrics, etc.): $100-$400/month. Faster setup, more data sources, less manual work.
Agency-built custom dashboard: $1,500-$5,000 one-time setup fee, often included in retainers above $3,000/month. Ask if you own the dashboard if you leave.
All-in-one platforms (SE Ranking, Agency Analytics, DashThis): $50-$300/month per user. Faster to deploy, less customizable.
The right choice depends on your team's technical comfort and how many data sources you need integrated. For most in-house teams managing one brand, the DIY Looker Studio approach with Supermetrics is the sweet spot. Agencies managing 10+ clients should look at dedicated reporting platforms where template replication saves significant time.
The Practical Takeaway
Stop building dashboards that impress people in meetings and start building dashboards that change decisions between meetings. Your competitive benchmarking framework should compare you against realistic competitors on metrics tied to revenue. Your SEO reporting automation should eliminate manual data gathering entirely so your team spends time on analysis, not spreadsheet jockeying.
Here are your next steps:
This week: Audit your current reporting. For each metric, ask "would removing this change any decision we make?" Cut anything that fails that test.
This month: Build (or rebuild) your dashboard using the four-page structure above. Connect Search Console, GA4, and one rank tracking tool at minimum.
Ongoing: Set up automated weekly distribution and alert triggers for significant metric movements. Add competitive tracking once your own baseline is clean.
The teams I see winning at SEO performance benchmarking aren't the ones with the fanciest tools. They're the ones who've done the hard work of deciding what actually matters, then built systems that make those numbers impossible to ignore.
Marcus Webb
Digital marketing consultant and agency review specialist. With 12 years in the SEO industry, Marcus has worked with agencies of all sizes and brings an insider perspective to agency evaluations and selection strategies.
Explore more topics